
In their latest U.S. Solar Market Insight report, GTM Research and the Solar Energy Industries Association (SEIA) said prices rose due to a tight global supply of modules and uncertainty around the Section 201 trade case now being weighed at the White House. What effect did this have on installations across solar segments? These numbers jumped out at us.
2,031 MW
That’s the number of megawatts of PV installed in the U.S. in the third quarter of the year — the eighth consecutive quarter that the solar industry added more than 2 GW. The capacity additions represent a 51 percent drop year over year.
10 percent.
That’s how much the residential PV sector fell quarter-over-quarter. Declining growth is driven by weakness in California and major Northeast markets, which continue to feel the impact of pull-back from national providers. More on that here.
22 percent.
That’s how much the industry is down compared to this point last year, which is in line with the expected 21% decline for all of 2016 vs all of 2017.
11.8 GWdc.
That’s how much new PV GTM Research estimates will come online in 2017, down 22% from a record-breaking 2016. The forecast has been adjusted downward from 12.4 GW last quarter to reflect continued challenges in the residential market and a push back in utility-scale completion timelines due to uncertainties surrounding the trade case.
22 percent.
Get this: That’s how much non-residential grew year-over-year, installing 481 MW in Q3. Non-residential consists of commercial and industrial businesses that install solar, nonprofits, and community solar programs. California, Massachusetts and New York all posted strong quarters while Minnesota had its largest quarter ever due to its robust community solar program. Nationwide, community solar capacity is on track to grow by more than 50 percent year-over-year.
51 percent.
That was the utility-scale segment’s piece of of the quarter’s installed capacity pie. The utility-scale segment was led by Nevada, North Carolina and Texas. In fact, Texas installed more solar in the third quarter of this year than the state installed in the entirety of 2015. Meanwhile, emerging markets in the Southeast, including Florida, Mississippi, and South Carolina all had strong quarters and are forecast to install more solar in 2017 than any year previously.
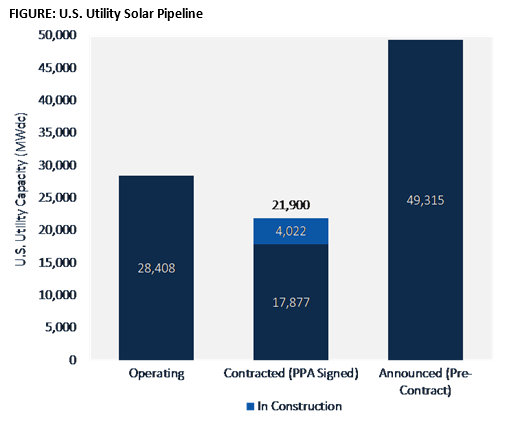
4 GW.
Encouragingly, that’s how much utility-scale PV is currently under construction across the nation, and GTM Research forecasts an additional 3.9 GW will come on-line by the end of the year. This would make 2017 the second largest year ever for solar installations behind only the record-shattering 2016.
“Looking forward to 2018 and beyond, both Section 201 remedies and corporate tax reform present considerable downside risk to the industry’s base-case forecasts. However, at present, neither issue will be incorporated into GTM Research’s existing outlook until President Trump issues a formal decision on Section 201 trade remedies and the U.S. Congress votes on corporate tax reform legislation.”
— Solar Builder magazine

[source: http://solarbuildermag.com/news/7-solar-install-stats-to-know/]
Leave a Reply
You must be logged in to post a comment.