Kudos to the people at MIT who created this interactive map showing property owners in the city how much electricity can be generated from their rooftops.
“In this project we developed a new simulation-based technique to reliably predict the annual electricity yield from an arbitrarily oriented and obstructed photovoltaic (PV) array located anywhere on the planet.” Alstan Jakubiec and Christoph Reinhart
ASSESSING A CITY’S SOLAR POWER POTENTIAL
A New Tool from SA+P’s Building Technology Program
SA+P researchers have developed a new interactive map to show a city’s property owners how much electricity can be produced on their rooftops from solar photovoltaic (PV) systems, how the financial investment will pay off and how much pollution will be reduced.
The new tool shows that if photovoltaic panels were installed on all good and excellent locations in MIT’s hometown of Cambridge, the city could generate about a third of its electricity needs via PV for about $2.8 billion. The technology has been found to predict electricity yield to within 4 – 10% of actual measured results.
Created as a proof of concept for more expansive efforts to predict yield from any photovoltaic array anywhere on the planet, the Cambridge Solar Map was developed by SA+P’s Sustainable Design Lab, directed by Christoph Reinhart, in collaboration with Modern Development Studio (MoDe Studio) — a consulting, design and development workshop — and the City of Cambridge Community Development Department.
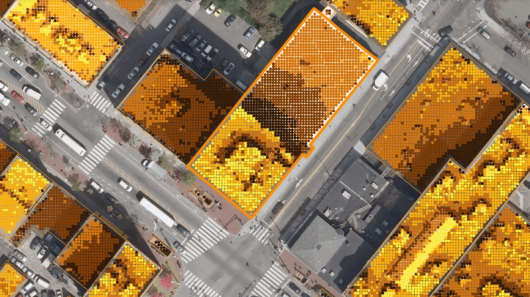
For its part in the collaboration, SA+P created the electricity yield map from PV for virtually all Cambridge rooftops by calculating the amount of electricity that could be generated over the course of a typical year on almost 17,000 roofs; each roof is then color-coded to show which parts have excellent, good, poor and no solar potential.
Under the direction of Eduardo Berlin, MoDe Studio designed and developed the online viewer and a financial analysis module that considers federal and state incentives for PV installations. The City of Cambridge provided the underlying data and images and will make the solar map available to the public on its website.
The assumptions and calculation methods underlying the map are significantly more accurate than those of comparable older solar maps used in other cities. Some solar maps, for instance, assume all rooftops are flat, an assumption that leads to errors in the case of a pitched roof which may have sloping and shady areas constraining the size of a PV system.
Another discrepancy between maps results from how radiation is calculated. The SA+P approach measures hourly solar radiation and temperature data for a site for a typical year, then translates that data into an actual sky condition for each hour of the year.
The amount of radiation on any given surface can then be calculated, including the effects of surrounding geometry such as trees and buildings, and solar cell efficiencies due to varying roof temperatures. Required simulation inputs are standard local weather station data and LiDAR data. (LiDAR – Light Detection And Ranging – is a remote sensing technique.)
The researchers caution that the tool is not a substitute for an on-site assessment by a solar installer because some specific building features (such as rooftop equipment), site conditions and financial factors might not be accounted for. But to maximize accuracy, the City of Cambridge intends to update the tool on a regular basis to reflect changing market conditions and financial incentives.
Support for the project was provided by the city’s Information Technology Department and the National Science Foundation.
For more information, visit the MIT site for the project. More technical details can be found here.
Source: MIT SA+P

[source: http://feeds.importantmedia.org/~r/IM-greenbuildingelements/~3/ibynhWH8Vb8/]
Leave a Reply
You must be logged in to post a comment.