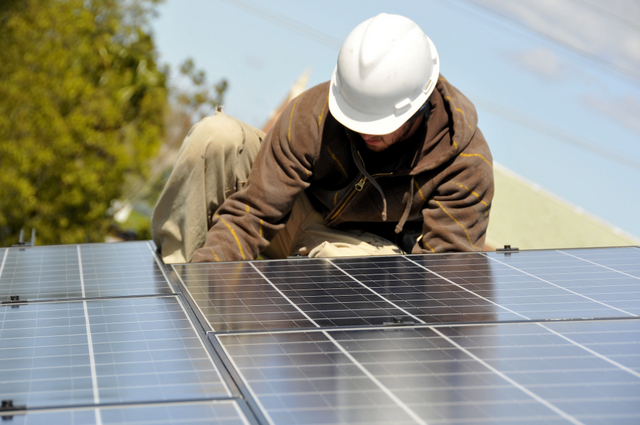
U.S. solar industry employment declined in 2017, while jobs increased in numerous states with emerging solar markets, according to the National Solar Jobs Census 2017, the eighth annual report on solar employment released today by The Solar Foundation. The Solar Jobs Census found that 250,271 Americans work in solar as of 2017, representing a 3.8 percent decline, or about 9,800 fewer jobs, since 2016. This is the first year that jobs have decreased since the Solar Jobs Census was first released in 2010.
However, the long-term trend continues to show significant jobs growth. The solar workforce increased by 168 percent in the past seven years, from about 93,000 jobs in 2010 to over 250,000 jobs in 2017.
Additionally, solar jobs increased in 29 states and the District of Columbia in 2017, including in many states with emerging solar markets. States with significant job gains include Utah, Minnesota, Arizona, Colorado, Pennsylvania, New Jersey, New York, and Tennessee.
California remains the state with the largest number of solar jobs nationwide, but jobs in California decreased 14 percent in 2017. In Massachusetts, the state with the second largest solar workforce, employment decreased by 21 percent. Access a complete table of solar jobs by state, along with the full report and other background information here.
“After six years of rapid and steady growth, the solar industry faced headwinds that led to a dip in employment in 2017, including a slowdown in the pace of new solar installations,” said Andrea Luecke, President and Executive Director at The Solar Foundation. “Uncertainty over the outcome of the trade case also had a likely impact on solar jobs growth. At the same time, the fact that jobs went up in 29 states is an encouraging sign that solar is taking hold across the country as a low-cost, sustainable, and reliable energy source.”
The Solar Foundation, a nonprofit educational and research organization, issues the National Solar Jobs Census each year to provide comprehensive and reliable data on the U.S. solar workforce. This year’s Census is based on a rigorous survey of solar establishments conducted between October and November 2017. The Census defines a solar employee as someone who spends at least 50 percent of his or her time on solar-related work.
Other key findings
Demand-side sectors (installation, sales & distribution, and project development) make up almost 78 percent of overall solar industry employment, while manufacturing makes up 15 percent. Demand-side sectors lost approximately 7,500 jobs in 2017, while manufacturing lost about 1,200 jobs.
The solar industry is more diverse than comparable industries, but more needs to be done to ensure it is representative of the greater U.S. population. Women made up 27 percent of the solar workforce in 2017, down 1 percent from 2016. Veterans made up 9 percent of solar workers, which is 2 percent more than the overall U.S. workforce.
Solar employs twice as many workers as the coal industry, almost five times as many as nuclear power, and nearly as many workers as the natural gas industry. (These comparisons with other industries are based on 2016 jobs numbers, the most recent data available for an apples-to-apples comparison.)
This year’s Census survey included approximately 59,300 phone calls and over 35,000 emails. Information was gathered from 2,389 establishments, of which 1,842 completed or substantially completed the survey. This level of sampling rigor provides a margin of error of +/- 1.25% for the national employment numbers.
— Solar Builder magazine
[source: http://solarbuildermag.com/news/solar-jobs-census-shows-first-jobs-decrease-since-2010/]

Leave a Reply
You must be logged in to post a comment.