Ask any solar developer, installer or asset owner if they have experienced inverter issues and the response is usually a resounding “yes!” There are stories of manufacturers that failed to honor warranty terms and products that failed to operate upon removal from their packaging. But the most insidious form of inverter failure is simple underperformance.
When inverters do not operate according to their datasheet specifications, projects usually fall short of their energy production targets. This translates directly to financial underperformance for asset owners. Further, when an underperforming inverter reports production data inaccurately, troubleshooting can be extremely difficult. Conducting technical due diligence to identify poor quality products prior to procurement can help prevent these problems in the field.
This article details recent technical due diligence results from the PV Inverter Product Qualification Program (PQP) from PV Evolution Labs (PVEL).
Temperature operating windows

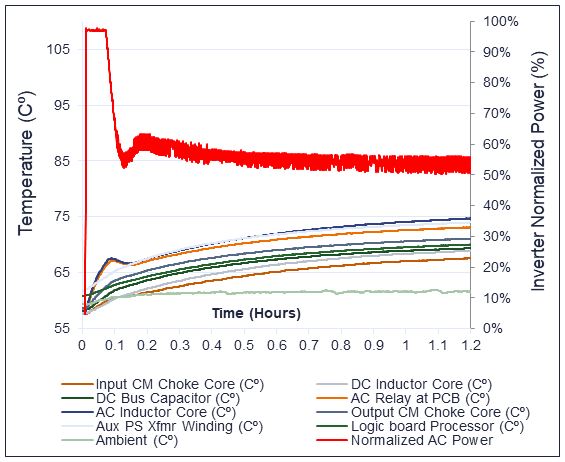
Figure 1: The chart displays PVEL’s high temperature operation test results for a commercial inverter. The inverter’s power output derated to 55% as internal component temperatures exceeded their maximum operating thresholds. During the entire test, the inverter was operating within specified limits for ambient temperature.
Every inverter datasheet lists a maximum and minimum ambient temperature in which the manufacturer has designed the product to operate. PVEL validates these parameters in the PQP’s three thermal performance characterization tests. The PQP process includes:
1. Placing the inverter inside of an environmental chamber. Depending on the test, the chamber is programmed to maintain the inverter’s maximum or minimum allowable temperature or to cycle through the inverter’s full temperature window.
2. Operating the inverter at 100 percent of its PV input capacity while under electrical load, which simulates a field-operational PV system.
As the tests are conducted, PVEL monitors the temperature of the inverter’s internal components along with its output power and other electrical signals. If a product operates as specified on its datasheet, it will produce 100 percent of its rated output power under these temperature conditions. About 35 percent of the products tested in PVEL’s PQP to date have derated, or reduced their AC power output, during thermal performance characterization. Many have derated by more than 10 percent.
One commercial inverter product tested at PVEL reduced its output power to 55 percent after just a few minutes of high temperature operation (see Fig. 1). If this product were installed in the field, it is extremely likely that the system would produce less energy than expected in high temperature environments, including sun-loading. Due to the design of this specific product, several of the inverter’s internal components would be forced to operate outside of their allowable maximum temperature thresholds in common environmental conditions. The thermal stress would likely accelerate the degradation of these components, leading the inverter to fail prematurely in the field.
AC voltage windows

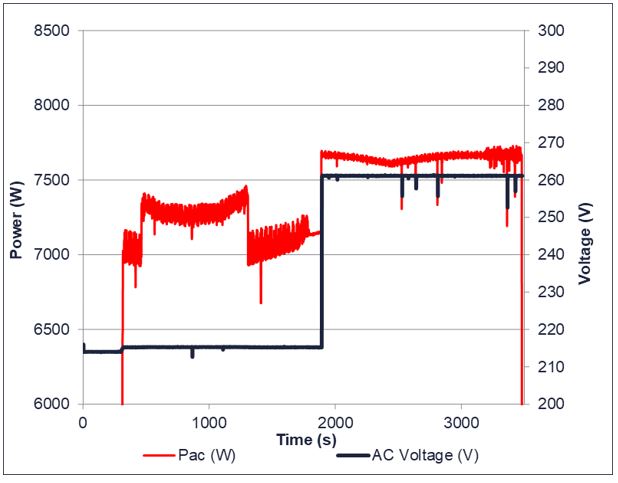
Figure 2: The residential inverter shown here has a nominal AC voltage of 240 V. At the upper limit of its AC voltage window, it has a fairly stable AC power output. However, at the lower AC voltage limit, there is significant variability and the product derates by as much as 7%.
Temperature is not the only factor to consider when it comes to power output: Inverters can also derate as a function of AC voltage. In installed PV systems, grid interconnection voltage, and its deviation from the inverter’s nominal voltage, cannot be controlled. Due to today’s evolving grid codes, inverters in many jurisdictions are also tasked with continued operation during grid sag and swell events. Their ability to do so is vital to the overall resiliency of the broader electrical grid.
As with temperature operating windows, PVEL’s AC operational window tests evaluate an inverter’s performance within the manufacturer’s stated AC voltage range. The inverter is operated in conjunction with a grid simulator, which allows for the AC voltage to be swept through the inverter’s low, nominal and high AC voltage range. Power is a function of current and voltage, so to maintain full power output the inverter must modulate current within the operational limits of its internal components. If the amount of current exceeds the thresholds of these individual components, the inverter will derate to prevent malfunctioning, as shown in Fig. 2.
As with temperature, products that derate within their AC voltage window may cause the system to produce less energy than anticipated. About 30 percent of the products tested in PVEL’s PQP experienced power derating within their stated AC operational bounds.
MPPT efficiency

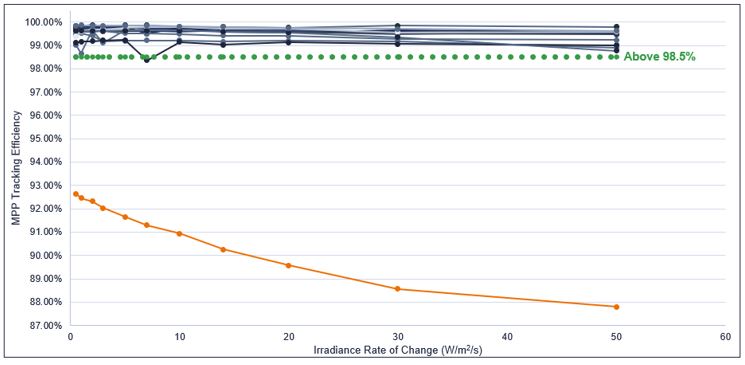
Figure 3: The chart above compares the MPPT efficiency of a selection of inverters during low-to-moderate changes of irradiance. The inverter shown in orange significantly underperforms compared to the other inverters in this sample, which are shown in blue. On average, the underperforming inverter is only able to follow the MPP for about 90% of the time during this test, whereas the other inverters in the sample achieve better than 98.5% MPPT efficiency on average.
The maximum power point (MPP) of a PV module or string of PV modules is always changing in the field. Clouds, temperature, degradation, shading, soiling — even bird droppings — can all contribute to non-ideal operating conditions. Effective maximum power point tracking (MPPT) algorithms can directly improve a system’s performance and ultimately boost the energy yields of the system. The goal of MPPT is to maintain the system’s input DC voltage at the point where the array can provide the maximum amount of energy.
PVEL measures MPPT efficiency according to EN 50530, the European Standard for evaluating MPPT, in both static and dynamic rates of change. In other words, inverter performance is measured during high and low rates of change as well as during static electrical conditions. Based on results from the PVEL PQP (see Fig. 3), many manufacturers have developed strong MPPT algorithms for their products — but not all.
For example, if the underperforming product shown in Fig. 3 were fielded and the asset owner had relied only on the datasheet when modeling predictive performance, the asset owner would likely experience lower than expected energy yield and diminished financial performance. As shown in PVEL’s data, the inverter was not able to harvest all available energy from the PV array.
Data that matters
PV project stakeholders have long relied on datasheets to model inverter performance for their assets under development or operation. In an ideal world, these stakeholders should be able to rely on datasheet parameters. In reality, inverters do not always live up to the stated specifications. When millions or even billions of dollars are at stake in a solar asset investment, stakeholders need a trusted, independent source to confirm that the products will perform as expected.
PV Evolution Labs (PVEL) is an independent lab for the global downstream solar and storage industry. Tara Doyle is PVEL’s chief commercial officer. Michael Mills-Price, formerly PVEL’s head of inverter and energy storage business, contributed to this article.
— Solar Builder magazine

Leave a Reply
You must be logged in to post a comment.