California has just taken a major step forward in bringing clean local energy online. The Clean Coalition played a major role in this progress as a leading advocate for streamlining the interconnection of distributed energy resources (DER) to the electric grid. On Dec. 28, 2018, California’s major utilities, Pacific Gas & Electric (PG&E), Southern California Edison (SCE), and San Diego Gas & Electric (SDG&E), published their updated Interconnection Capacity Analysis (ICA) maps, or ICA 2.0. These online grid maps are a product of the Distribution Resources Plan (DRP) proceeding at the California Public Utilities Commission (CPUC), in which the Clean Coalition has been the leading non-utility intervenor.
“The updated ICA maps make a great leap forward from what has been available to date,” said Sahm White, Economics and Policy Analysis Director at the Clean Coalition. “The new maps take a huge amount of risk and uncertainty out of DER project development, which will result in more of these projects being built at lower cost. A developer can now determine, early in the decision-making process, what size of project can be sited at any location with little or no modification to the existing grid. This is critical for easily choosing the best locations for siting projects, and then for projects that are moved forward, being informed with realistic costs and timing expectations regarding interconnection.”
- PG&E’s updated ICA map can be accessed here.
- SCE’s map, known as their Distributed Energy Resources Interconnection Map, or DERIM, can be found here.
- SDG&E’s map can be accessed by registering at this link.
The drama
The expected July publication of the ICA 2.0 maps was delayed because of unwarranted issues raised about exposing easily discernable grid details, such as the location of substations. This concern led the utilities to take the drastic step in September of restricting access to their existing maps, which had already been publicly available since 2012. Fortunately, that action was reversed when Administrative Law Judge Robert Mason ruled on October 9 that the previously published maps should be made publicly available again. In a subsequent ruling on December 17, 2018, Mason directed the utilities to make the ICA 2.0 maps available by December 28, 2018 through a public portal, like the predecessor maps had been accessible for over half a decade.
Importance of the ICA maps

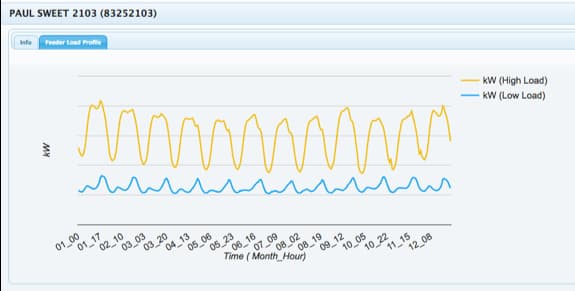
Example of new ICA maps, showing color-coded existing capacity and detailed information for the specific identified point, as well as circuit load profiles, at the Paul Sweet substation

ICA maps assess all points on the existing distribution grid for accommodating new DER capacity without significant grid upgrades. The maps, which contain details on available interconnection capacity, are crucial tools for bringing DER online more quickly and cost-effectively.
Interconnection is often the most complex, uncertain, and time-consuming aspect of DER project development. This is particularly true for smaller projects, which can easily be rendered uneconomic due to a lack of predictability in terms of interconnection costs and timelines. For this reason, since 2010 the Clean Coalition has successfully pushed for utilities to provide increasing-ly detailed and accurate interconnection data in the grid maps, which help project developers and property owners determine whether sites are appropriate for serious DER siting consideration.
The ICA 2.0 update represents the first full-scale release of ICA maps with reliable data. Although the utilities published demonstration ICA maps in 2015 with detailed data, those maps relied on models and assumptions that did not meet the accuracy standards required by interconnection engineers. In contrast, the ICA 2.0 maps can be used with a high degree of accuracy for interconnection assessments. The new maps evaluate the most common interconnection capacity factors at the node level on every line section of all primary distribution circuits — that is, at every point on the circuits where there can be a change in values that would affect the ICA results. Significantly, for the sake of facilitating certainty and accuracy for project developers and property owners, the maps are publicly available and will be updated every month.
Craig Lewis, Executive Director of the Clean Coalition, added, “ICA 2.0 provides an unprecedented level of transparency and certainty through publicly available grid data. There is still a long way to go to truly streamline interconnection processes for commercial-scale DER in California, but ICA 2.0 provides the first real foundation for distribution grid planning in the United States. With continuing efforts, California will keep improving, and other states, and even FERC, will at least match California’s progress in streamlining interconnection for local renewables and other commercial-scale DER.”
The Clean Coalition has been a major contributor in the effort to publish and improve the ICA maps, providing the vision for modernized, streamlined interconnection processes and leading the effort to realize that vision.
While ICA 2.0 is a welcome major development, there are more improvements to come. Next steps have already been defined for ICA 3.0 and include these additional ICA refinements:
- Current ICA maps pertain to just the distribution grid. ICA 3.0 will add constraints related to the transmission grid that could affect interconnection — for example, other projects being proposed for that part of the transmission grid.
- ICA 2.0 maps model each circuit, but they do not show how a circuit may affect neighboring circuits. ICA 3.0 will dynamically model multiple circuits and their impact on one another.
- ICA 3.0 will aim to update the maps in real-time, to ensure that the results are never out of date.
— Solar Builder magazine

Leave a Reply
You must be logged in to post a comment.