
Raptor Maps raised its Series A funding this past year to expand its focus to the entire solar lifecycle. The startup has historically been strong in aerial inspections for commissioning, preventive maintenance, and investigations. Their software-first approach enables them to pinpoint causes of production loss. We asked them to share the latest trends in the industry, specifically — where should owners and operators focus their efforts? Here is what Nikhil Vadhavkar, co-founder and CEO, had to say. He is an MIT engineer, Y combinator alum, and PV system remote sensing expert.
Each year, we publish a global aerial inspection report that details key findings and trends from the last 12 months. This year’s dataset is the largest ever, drawing from 22 GW of Raptor Maps PV system inspections in 27 countries. The “22” was also the average number of times a data owner shared the results of an inspection report with a collaborator or counterparty. The reasons behind this may surprise you as well.
Overview of the Global Report
Our global report details the frequency and magnitude of underperformance uncovered via aerial inspection and delivered through our software. Aerial inspection is a technique mandated by owners and operators to meet commissioning, preventive maintenance, and warranty inspections requirements. Aerial inspection fuses site-specific schematics with thermal and color image data captured under specific conditions by unmanned or manned aircraft.
From the 22 GW data subset used, we found that 1.9% of the total plant capacity was affected, amounting to a net present value (NPV) of $435 million. The affected capacity in the global reports has fluctuated from year-to-year, reflecting remediations, new anomalies, changing asset management practices, and a trend toward more granular (e.g., IEC-compliant) inspections.
Quantifying Collaboration
In this year’s global report, we included a new statistic: collaboration. We discovered that, on average, the data owners share their PV system inspection results with 22 other users. This includes both the synthesized analysis and the original, unmodified aerial inspection data. These users range from collaborators within the data owner’s organization (e.g., an O&M authorizing a field technician to review the results) to users in counterparty organizations (e.g., an owner sharing the analysis with a module manufacturer, or vice versa).

The above image is an industry network graph of a subset of the data. Smaller clusters tend to be within an organization, and longer lines indicate collaboration between organizations.
The most frequently shared analyses were IEC TS 62446-3:2017-compliant inspections for commissioning and warranty claims, and inspections incorporating on-site pyranometer data. The data and our customer interactions indicate that by leveraging software to collaborate with counterparties, owners and operators receive more positive resolutions from EPCs and module manufacturers. Additionally, owners have become more sophisticated and are setting more appropriate thresholds for remediation, which has reduced the barrier to collaboration with their O&M.
This year, we have also seen more engagement from module manufacturers, both as direct customers and as counterparties. Several module manufacturers have either directly accepted IEC-compliant analyses for warranty claims, or have enabled Raptor Maps customers to re-stratify findings on IEC-compliant data based on factory guidance.
Industry at the Tipping Point
The solar industry is already more relationship-driven than most, and we wanted to find out why users have an increased need to collaborate with each other. We took a deeper dive to not just answer “Why?” but to understand “Why now?”. Here’s what we found:
Transparency. The traditional mental model for an inspection report gives us two ends of a spectrum. On one end, there is the original data (which can be hundreds of pages), that requires expert interpretation and inference. On the other, is a high-level analysis detailing financial impact or simply an indication that the work was performed. Sharing only the former can create confusion and cause a “data overload” while sharing the latter may feel like a “sugarcoat.”
Software solves this problem and eliminates this false dichotomy by drawing from a data model in which users can start at a high level, and, if desired, click down to the underpinning data. Software also enables the solar industry to access data products tailored for end-users, from field technicians and performance engineers to asset owners to in-house software developers.
Standardization. As evidenced by the industry network graph, the relationships between counterparties in the solar industry are complex. Even parties that attempt to standardize are often faced with legacy agreements or other constraints that will result in contracting with multiple parties performing partially-overlapping functions.
Standardization of a solar-specific data model and publicly available documentation to access and manipulate that model ensures that data does not remain siloed by individual agreements. Furthermore, enforcement of industry standards, such as data capture standards, ensures that the input data and method of analysis is consistent. In the case of aerial inspection, this has increasingly become the case.
Benefits of this standardization that we have observed include:
● Establishment of a benchmark with a commissioning inspection, which can be compared to preventive maintenance inspections year-over-year
● O&M companies utilizing data capture standards to develop hybrid programs (with both in-house pilots and turnkey services)
● Asset owners unifying analytics from preferred asset managers and O&M vendors with legacy contracts or regional providers
● Eliminate duplicate costs and time lost when investigative inspections are requested by module manufacturers
Prioritization. Solar industry professionals are among the busiest, and increased telepresence has created an “always on” culture. This means that collaborators and counterparties are constantly competing for attention. Our most significant finding is that those who leverage standardization, transparency, and collaboration are prioritized. They provide all needed evidence to achieve a positive outcome in the most user-friendly way possible, resulting in concise and effective communication. They earn bandwidth and time on the counterparty’s calendar. Faster resolutions translate to an increase in internal rate of return (IRR) and enable more assets to be managed per head.
Reaction to Externalities. COVID-19 changed the outlook for the solar industry in 2020 and 2021. In addition to new installation delays, solar operators have sought to minimize physical movement. It has been especially difficult for owners and managers, who typically do not “turn wrenches,” to justify site visits. The need for increased awareness without a physical presence is the reason why there are so many Zoom meetings on your calendar, and this same drive has necessitated an increased reliance on software.
Causes of Underproduction
The global report also revealed the most frequent causes of underproduction in utility-scale and C&I assets in the past year. The study encompassed over 70 million modules, 92 module manufacturers, and 1,126 PV systems. On average, Raptor Maps inspections revealed that 1.9% of power production is affected, compared with 1.6% from the previous year.
Classifications included in the study include functional units, such as off-nominal inverters and trackers, environmental conditions, such as shading and soiling, and module-level findings, such as cracking and activated bypass diodes.
As detailed earlier, the technique used for data collection and analysis was aerial inspection, which fuses site-specific schematics with thermal and color image data captured under specific conditions by unmanned or manned aircraft.
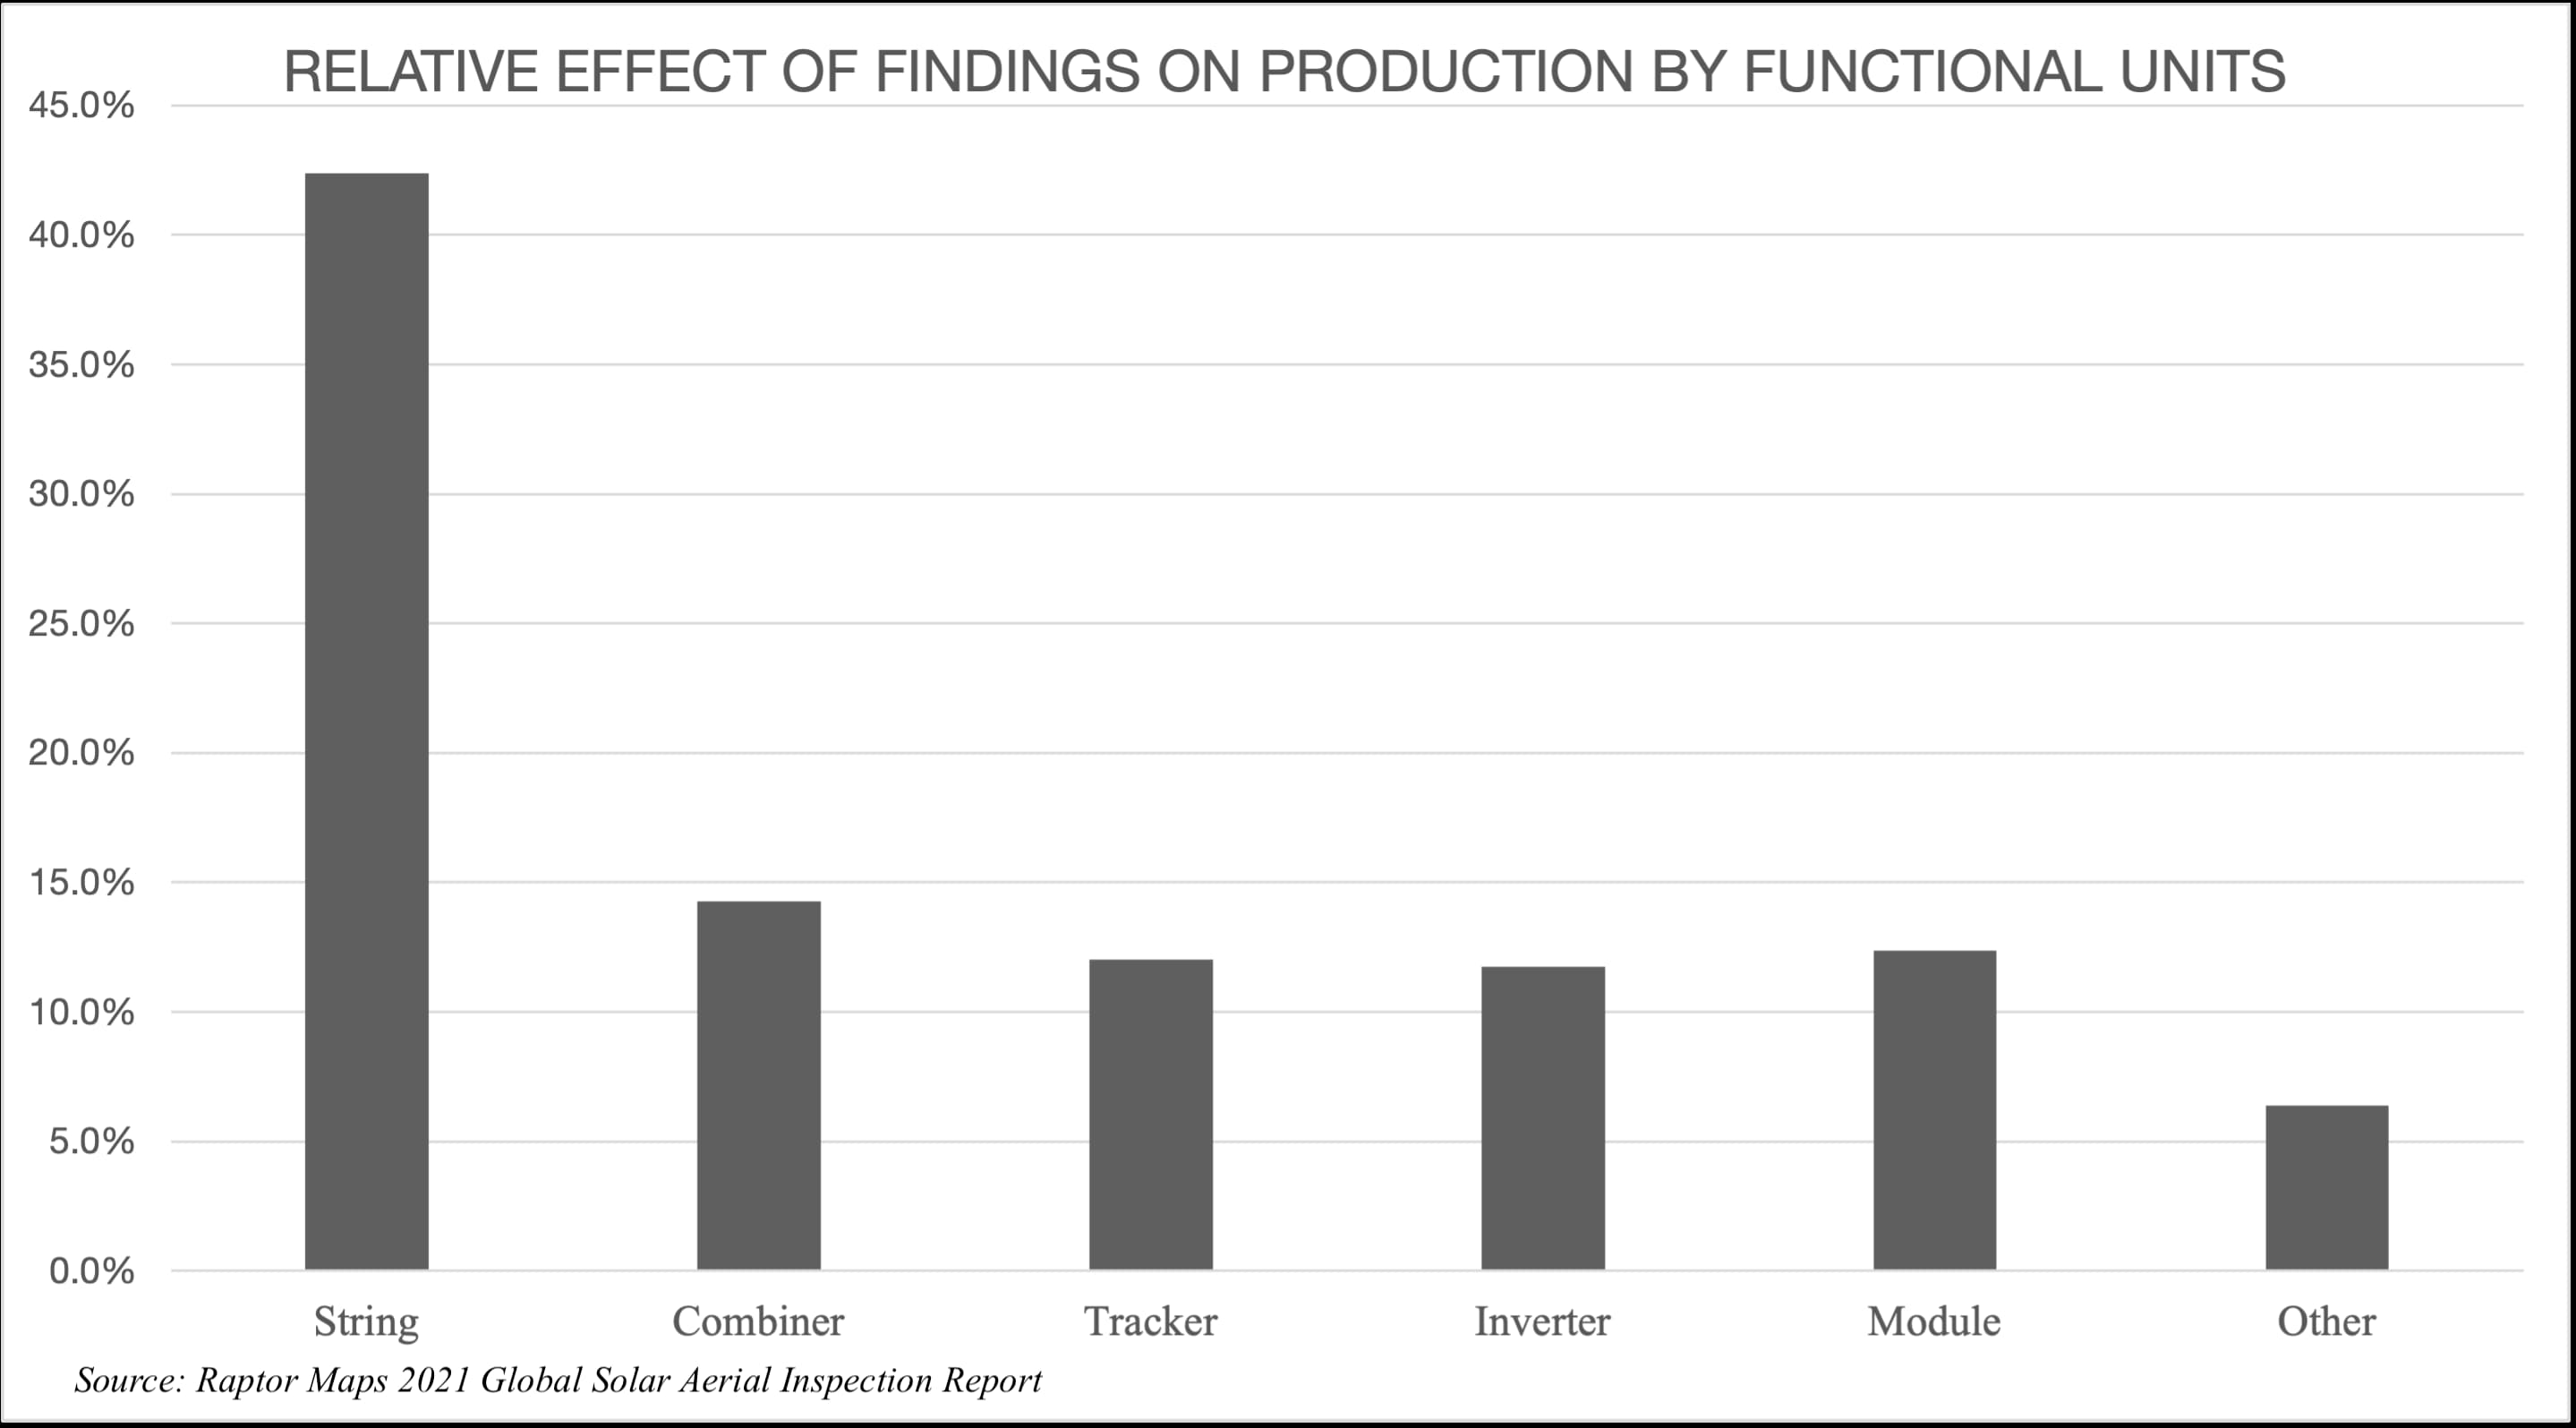
The figure above displays the percent of production affected by functional units within a PV system, including inverters, combiners, trackers, strings, and modules. String and combiner anomalies were the largest cause of production impact, while module-level impact surprisingly outpaced inverter impact this year. The module-level anomalies are further stratified in the global report.
Modules from 92 manufacturers are included in the report. Of the total number of modules inspected, 84% were Bloomberg New Energy Finance (BNEF) Tier 1 modules. The most common module technology was polycrystalline.
Looking to the Future
With the renewed interest in renewable energy and climate tech, the solar industry no longer flies under the radar. Any way we slice it, whether it’s capital deployed, assets built, assets under management, or kWh of renewable energy produced, the expectations of solar industry professionals will continue to increase. Software is now a requirement, and we all must do our part to collaborate effectively, achieve positive outcomes, and keep the (proverbial) solar flywheel spinning.
— Solar Builder magazine

Leave a Reply
You must be logged in to post a comment.