This is an excerpt from the Q2 2023 issue of Solar Builder magazine, written by Tristan Erion-Lorico is VP of sales and marketing for PV Evolution Labs (PVEL). He relays insights from the 2023 Module Reliability Scorecard. PVEL’s Scorecard offers a searchable database of module types with details on each test and the Top Performers in that category. Browse the Scorecard here. Subscribe to Solar Builder magazine for free right here (print or digital).
The landscape for PV module technology is rapidly evolving as global demand for new solar capacity grows. As developers and installers scramble to procure available module supply, this growth is driving a diversification in commercially available solar modules and brands.
To navigate these new products with confidence, module purchasers need to understand how the unique bill of materials (BOM) for each module they procure is expected to perform. Likewise, project stakeholders need to understand the potential issues that could arise from various BOM combinations that may cause sites to underperform in the field.
Extended reliability testing
For over a decade PVEL, a member of the Kiwa Group, has subjected solar modules to its Product Qualification Program (PQP), a series of extended-duration reliability and performance tests that go beyond certification requirements to help module buyers make more informed procurement decisions. In that time, the company has tested more than 500 different BOM combinations from more than 50 module manufacturers. A snapshot of results from PVEL’s independent testing is reported in its annual PV Module Reliability Scorecard.
This year, the Scorecard features more manufacturers than ever — a total of 35 companies, producing modules in 12 different countries, with more than 250 Top Performer model types. In the report, PVEL highlights that 13 manufacturers achieved “All Star” results. These models are Top Performers in every reliability test listed in the Scorecard, including:
- Thermal cycling (TC),
- Damp heat (DH),
- Mechanical stress sequence (MSS),
- Potential induced degradation (PID), and
- Light induced degradation plus light and temperature induced degradation (LID+LETID).
Many of the 2023 Scorecard results showcase the ways in which PV module designs have improved over time, with particularly notable progress observed in thermal cycling and damp heat results. However, while the total number of Top Performer manufacturers increased this year, so did the percentage of manufacturers that experienced a failure.
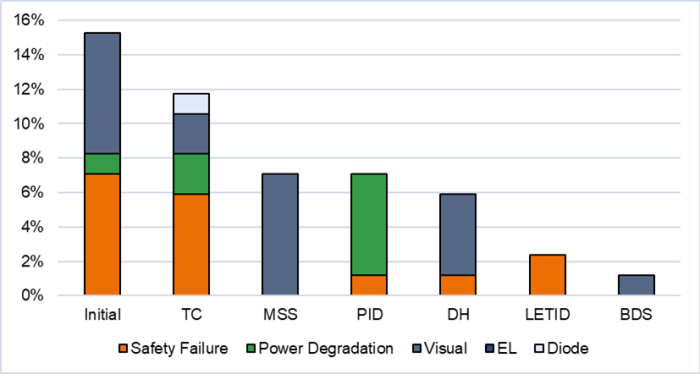
Almost one-third of BOMs in the 2023 Scorecard test population suffered at least one failure during testing, an increase from the previous year. This exemplifies that while some results have improved, buyers still need to use caution when assessing the modules they are considering.

N-type vs. P-type
As the industry transitions to N-type technologies, extended testing can help pinpoint crucial performance and reliability considerations. While P-type PERC remains the dominant cell technology across the 2023 Scorecard’s Top Performers, there are 37 N-type TOPCon model types from six manufacturers listed as Top Performers, compared to only one N-type TOPCon Top Performer in the 2022 Scorecard. Nine N-type HJT model types are also included in this year’s list of Top Performers, up from only two last year.
While these are encouraging signs of N-type reliability, it is worth remembering that technology type alone is not an appropriate indicator of overall lifetime performance. Procurement managers should dig deeper into test specifics to identify results that matter most at their site location.
For example, top performing TC results are most critical in locations where temperatures are much lower at night than during the day, such as desert environments, because PV module components expand and contract as temperature changes, stressing the various layers and bonds.
The 2023 Scorecard shows equally reliable results for PERC and TOPCon based on the median degradation for BOMs using each technology. However, almost 12% of BOMs experienced one or more failures during TC testing — a trend not linked to a specific module technology. Furthermore, some HJT modules experienced higher TC-related degradation, likely due to the low temperature required for soldering.
By contrast, solar projects in hot environments with high humidity require PV modules with top performing DH results. During DH testing, PVEL assesses susceptibility to moisture ingress, delamination and corrosion by subjecting modules to a constant 85°C and 85% relative humidity in an environmental chamber for two periods of 1,000 hours.
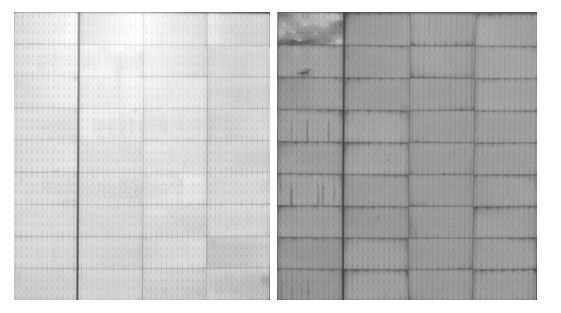
While PVEL’s recent testing showed no major differences between cell technology types with regards to the median degradation rates, that doesn’t mean all modules are created equal. In areas where heat and humidity are a concern, cell technology type may matter less than laminate type. DH testing showed meaningful differences between the degradation rates of glass//glass and glass//backsheet modules. See Fig. 1 for a great example.

Fig. 1: PVEL tested two BOMs produced by the same module manufacturer that used the same cells and same front encapsulants. Left: Glass//glass BOM post-DH2000 with a pristine EL image and 1.5% power loss. Right: Glass//backsheet BOM post-DH2000 the module experienced >7% power loss and signs of corrosion are clearly seen around the cells’ perimeters and along some bus bars. (EL images have been cropped to maintain anonymity)
In PVEL’s LID and LETID tests, used to evaluate relatively early life power loss in the cell, non-PERC cell technologies greatly outperformed PERC modules. The average LID + LETID power loss across CdTe, N-type TOPCon and N-type HJT BOMs was 0.0% and the median was 0.2%, showing that these technologies are generally not susceptible to these degradation modes. Meanwhile, the average LID + LETID power loss of PERC was 0.7%.
Keep reading …
For the full article from the magazine, access the digital edition right here.
— Solar Builder magazine

Leave a Reply
You must be logged in to post a comment.