The Solar Foundation has updated its map on the number of solar jobs in every state, metropolitan area, county, and congressional district, revealing how solar energy is supporting local economies nationwide. The interactive map includes previously unreleased data on solar jobs by metropolitan statistical area (MSA), county, and federal and state congressional district, along with detailed statistics on the solar workforce in each state. The Solar Foundation also released detailed fact sheets on all 50 states, the District of Columbia, and Puerto Rico.
The interactive map can be viewed at SolarStates.org.
The Solar Jobs report found there are 242,343 solar workers in the United States as of 2018. Nationwide, solar jobs declined 3.2 percent from 2017. At the same time, jobs increased in 29 states, including many states with emerging solar markets.
“Despite the short-term jobs decline nationwide, it’s very encouraging that solar jobs increased in several major cities last year, and the continued expansion of the U.S. solar industry bodes well for job growth in the future,” said Andrea Luecke, President and Executive Director at The Solar Foundation.
The metro area with the most solar jobs overall was San Francisco-Oakland-Fremont, California, with 22,101 solar workers. However, jobs in the region declined by 9.7 percent in 2018. The other top MSAs for the total number of solar jobs include Los Angeles, New York, San Diego and Boston.
Eight of the top 10 counties for solar employment were in California, led by Santa Clara County with 11,301 solar workers. Maricopa County, Arizona (6,472 jobs) and Utah County, Utah (4,024 jobs) were also among the top ten.
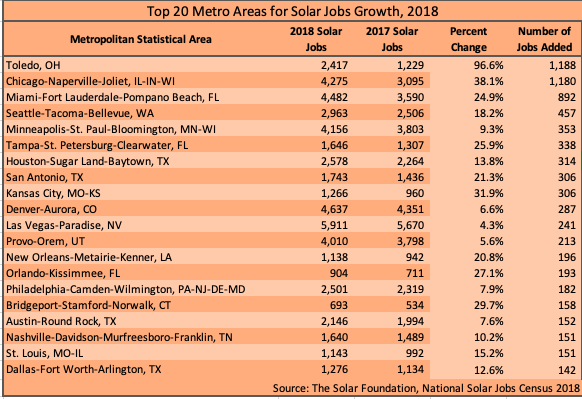
Some of the top metro areas for the number of solar jobs added in 2018 include Chicago, Miami, Seattle, and Minneapolis-Saint Paul, among others.
State level
At the state level, California continues to lead the nation with 76,838 solar jobs overall. However, solar jobs in the state decreased 11 percent from 2017. Florida now has the second-highest number of solar jobs, with 10,358 solar workers, in a 21 percent increase from 2017.
Other top states for solar jobs include Massachusetts (10,210 jobs), New York (9,729), Texas (9,612), Arizona (7,524), Ohio (7,162), Colorado (6,847), North Carolina (6,719), and Nevada (6,680). Notably, jobs in Illinois increased 37 percent in 2018, for a total of 4,879 solar workers.
The solar jobs map includes four years of data from 2015 through 2018 to show year-over-year trends in local solar job growth. In addition to the jobs numbers, it includes data on solar jobs by industry sector for each state; solar workforce demographics by state; important solar policies that states have adopted; and much more.
Data for the Solar Jobs Map is based on a rigorous survey of solar establishments conducted between September and October 2018. The survey included approximately 59,300 phone calls and over 49,000 emails. The survey was administered to 13,945 separate establishments, of which 2,697 provided full or substantially completed surveys.
— Solar Builder magazine


Leave a Reply
You must be logged in to post a comment.