The Solar Foundation today released an updated map on the number of solar jobs in every state, metropolitan area, county, and congressional district, revealing the geographic distribution of America’s 250,271 solar jobs. The interactive map can be viewed at SolarStates.org.
The new solar jobs map is a follow up to the National Solar Jobs Census 2017, the eighth annual report on America’s solar workforce issued by The Solar Foundation, a nonprofit educational and research organization. Along with the map, The Solar Foundation released 52 fact sheets on the solar workforce in each state, the District of Columbia, and Puerto Rico.
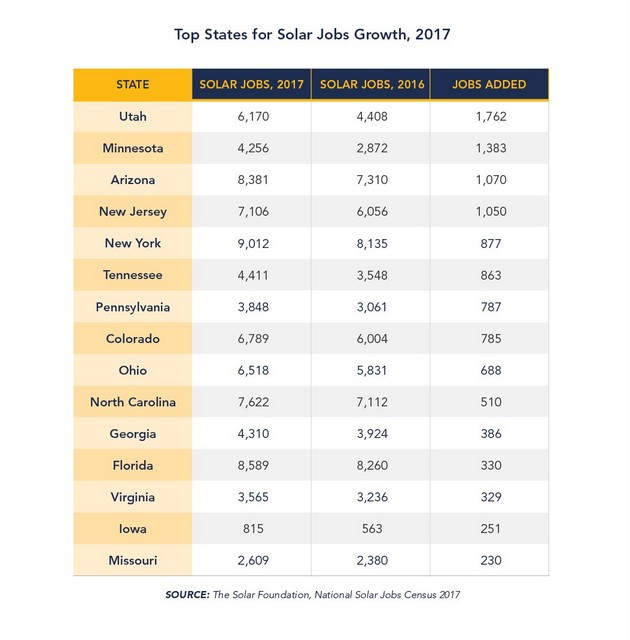
The National Solar Jobs Census 2017 found that nationwide, solar employment declined 3.8 percent, from 260,077 jobs in 2016 to 250,271 in 2017. At the same time, solar jobs increased in 29 states and the District of Columbia, as well as in major metropolitan areas throughout the nation. This growth took place in many states with emerging solar markets, such as Minnesota, Utah, Florida, North Carolina, Pennsylvania, Georgia, and others.
“Our solar jobs map shows that many states and cities bucked the national trend and enjoyed significant jobs growth in 2017,” said Andrea Luecke, President and Executive Director of The Solar Foundation. “As solar technologies rapidly become more affordable and abundant, solar jobs nationwide have nearly tripled since 2010. These jobs are in solar installation, project development, sales and marketing, manufacturing, engineering, and many other skill areas. In the future, states and localities should look to solar as a key strategy for building local economies and supporting high-quality careers.”
California remained the state with the leading number of solar jobs in 2017 (86,414), though jobs in the state declined 14 percent from 2016. Among states that saw solar job growth, the state that added the most jobs in 2017 was Utah, followed by Minnesota, Arizona, New Jersey, and New York.
Metro area analysis
Metropolitan areas and counties in diverse parts of the country saw significant job growth in 2017. The metro area with the highest total number of solar jobs was San Francisco-Oakland-Hayward, California, at 24,474 jobs, though employment declined 6 percent from 2016. Some of the metro areas where jobs grew significantly in 2017 include greater Provo-Orem, Utah (3,798 total jobs), New York-North New Jersey-Long Island, New York (12,038 jobs); Minneapolis-St. Paul-Bloomington, Minn. (3,803 jobs); Phoenix-Mesa-Scottsdale, Ariz. (7,204 jobs); and Philadelphia-Camden-Wilmington (2,319 jobs).
Other metropolitan areas that saw job growth in 2017 include greater Denver, Colorado; Miami, Florida; Orlando, Florida; Tampa, Florida; Cincinnati, Ohio; Kansas City, Missouri; Charleston, South Carolina; Milwaukee, Wisconsin; St. Louis, Missouri; and Detroit, Michigan, among others.
“We are very excited to see so much solar job growth in Philadelphia,” said Philadelphia Mayor Jim Kenney. “Philadelphia has taken several steps to expand solar development, including our work to achieve SolSmart Gold designation, and launching the Solarize Philly program. We are committed to reducing citywide carbon emissions 80 percent by 2050 and transitioning to a 100 percent clean energy future. A solid solar workforce is key to achieving those goals.”
“We believe the transition to a clean energy future is one of the greatest opportunities of the 21st century for cities to improve community health, quality of life, environmental sustainability, and a vibrant and robust economy,” said Orlando Mayor Buddy Dyer. “Our city is proud to be a part of growing solar jobs here in Florida and we remain committed to helping lead the transition to 100% renewable energy.”
Data for the National Solar Jobs Census is based on a rigorous survey of solar establishments conducted between October and November 2017. The Census defines a solar employee as someone who spends at least 50 percent of his or her time on solar-related work.
— Solar Builder magazine


Leave a Reply
You must be logged in to post a comment.