Here are the key numbers in the just released U.S. Solar Market Insight 2018 Year-in-Review Report from Wood Mackenzie Power & Renewables and the Solar Energy Industries Association (SEIA).
10.6 GW
This is the amount of solar PV capacity that came online in 2018 — the third year in a row of double-digit GWs installed. Cumulative operating solar photovoltaic capacity in the U.S. is now at 62.4 GW — about 75 times more than was installed at the end of 2008.
2 percent
This is the decrease of installed capacity from 2017, which is all attributable to the Trump tariffs. The forecast shows the market rebounding in the years ahead. Non-residential PV and utility-scale PV declined 8 and 7 percent, respectively.
14 percent
That’s how much the total installed PV capacity in the U.S. is expected to rise by in 2019, with annual installations reaching 15.8 GW in 2021.
13.2 GW
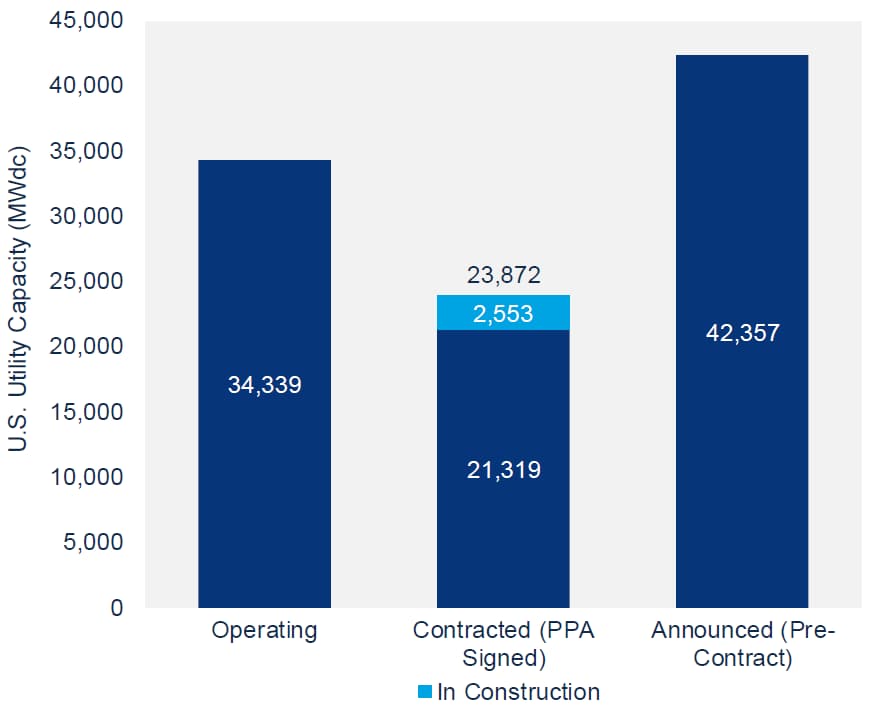
That’s how much utility-scale solar was signed for via power purchase agreements, pushing the contracted project pipeline to its highest point in the history of U.S. solar. The contracted pipeline peaked in Q3 2018 at 25.3 GW the highest in the history of U.S. solar.
15.8 GW
That’s the expected annual solar installation capacity in 2021, prior to the expiration of the residential federal Investment Tax Credit (ITC) and a drop in the commercial tax credit to 10 percent for projects not yet under construction. The total installed U.S. PV capacity will more than double over the next five years.
— Solar Builder magazine


Leave a Reply
You must be logged in to post a comment.