
Accurately predicting power generation for PV sites is critical for prioritizing relevant operations & maintenance activities, thereby extending the lifetime of a system and improving profit margins. A number of factors influence power generation at PV sites, including local weather, shading and soiling losses, design of modules, DC mismatches, and degradation over time. Other external factors such as curtailment and grid outages can also have a notable impact on power generation.
Machine learning techniques can be used to provide more accurate predictions of PV power production by accounting for important weather and climate information neglected by current industry methods. This article will cover the deficiencies of those methods and will show how machine learning can dramatically improve power generation predictions.
Traditional performance analytic methods have room to improve
Until recently, performance management has heavily focused on creating indices to evaluate the performance and availability of a PV system. The International Electrotechnical Commission (IEC) standard equation from IEC 61724 and PVSyst (P50) models represent two common methods to calculate predicted energy values, and are compared to actual production to calculate performance ratios. Although these performance indices are good tools to identify site-and device-level issues in real time, the current methodologies do have notable limitations.
Industry experts have noted that important factors, such as inverter clipping and curtailment activities, are overlooked in current calculations. An evaluation by industry experts in the Solar Risk Assessment report noted that predicted values were greater than measured energy by a median of 3%, and as much as 20% (DNV GL 2019: “Narrowing the Performance Gap: Reconciling Predicted and Actual Energy Production”). Similar discrepancies were observed between the measured and predicted values for Trimark’s sites as well. Figure 1 illustrates this, as most of the observations do not fall along the target line (where measured energy ideally equals predicted energy); these discrepancies indicate opportunities for improving current approaches for predicting energy.
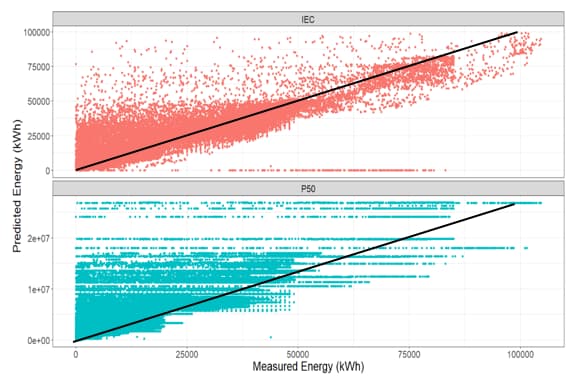
Figure 1: A comparison of measured energy values with predicted energy values from the IEC standard calculation (top) and PVSyst (P50) model (bottom). The significant deviations from the target line (black) indicate opportunities for improving current methods for predicting energy.
Machine learning can improve performance estimates
The goal of the research effort between Trimark Associates and Sandia National Laboratories is to develop a more robust model that improves upon traditional models for predicting energy. The tremendous amount of historical data available in Trimark’s SCADA system is leveraged for this work. For this analysis, we specifically looked at one year’s worth of PV data for 100+ sites across the U.S. (Figure 2).

Figure 2: Sites from Trimark’s SCADA system used in the analysis
For this analysis, we use a multi-level regression machine learning technique that incorporates both system-level design considerations (inverter size, DC/AC ratio, and array type), time parameters (site age, month, and time of day), and site-specific weather conditions (irradiance, temperature, and climate zone) in the function. Climate zone information was specific to PV classifications (Karin, T., C.B. Jones, and A. Jain 2019: “Photovoltaic Degradation Climate Zones”).
Preliminary findings show significant improvements over existing methods
Initial exploratory data analyses show that machine learning regression models track better along the target line, improving on the traditional predicted energy calculations (Figure 3).
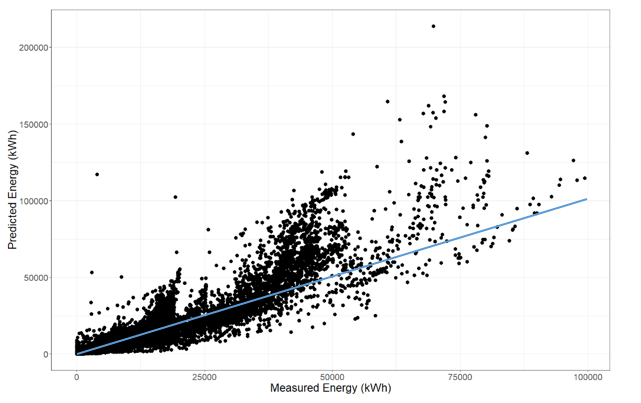
Figure 3: Outputs from the machine learning algorithm. Observations are closer to the target line (blue) with fewer overestimates.
A comparison of the parameters used in the algorithm indicates that system design features were the most important in the algorithm calculations. Specifically, the AC capacity, DC/AC ratio, and array type capture more than 90% of the variation in predicted values, while irradiance and time metrics accounted for the remaining 10% (Figure 4).

Figure 4: System design features were the most important factors in the algorithm.
The analysis also confirms that accounting for clipping (including associate climate zone considerations) is critical for improving energy predictions (Figure 5). For example, sites located in the PVCZ 33 typically had the highest clipping rates at 12 p.m. local time, whereas other climate zones had relatively higher rates at 1 p.m. local time (Figure 5).
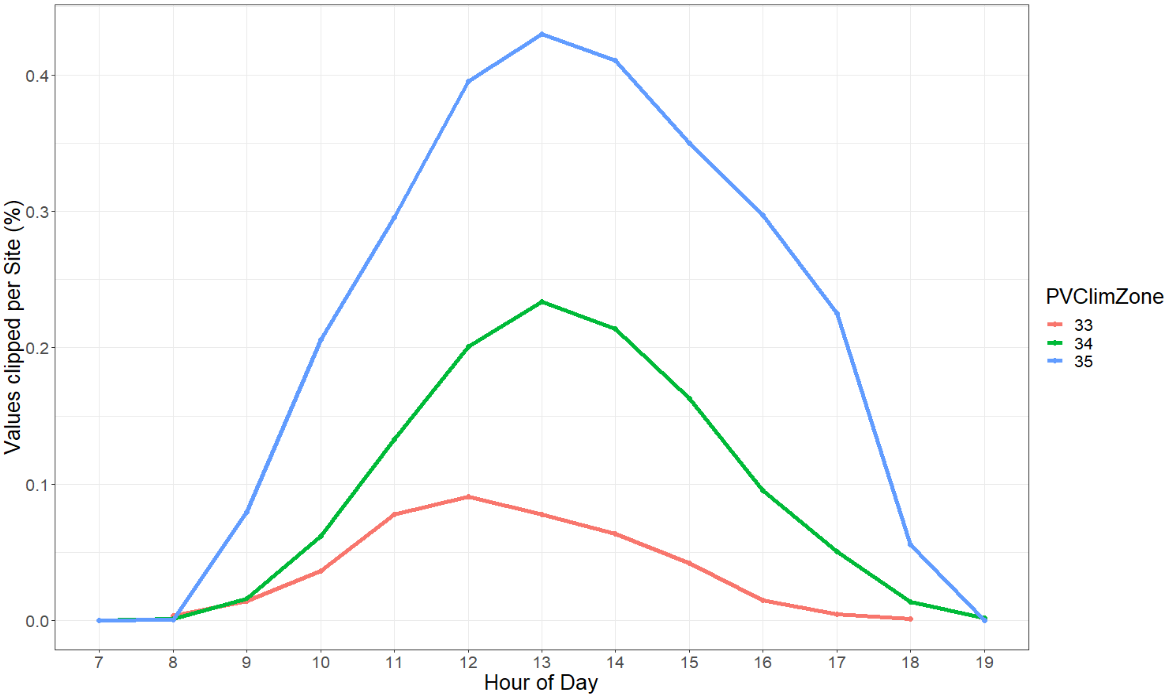
Figure 5: Clipping patterns over the course of the day at different climate zones. Highest rates in clipping were observed in the middle of the day.
The findings represented in this study are but a small taste of how machine learning can be leveraged to improve PV performance monitoring. Regression algorithms are a particularly exciting approach to implement within Trimark’s SCADA system, providing an additional, more accurate method of predicting plant generation alongside the industry baseline IEC and P50 models.
While there is still so much potential to explore, machine learning nevertheless shows its worth in these regards. As such, it is important that we as an industry continue to prioritize – and collaborate on – its research, thereby fine-tuning a technology that possesses the capacity to fundamentally transform the ways in which we predict PV generation.
This material is based upon work supported by the U.S. Department of Energy’s Office of Energy Efficiency and Renewable Energy (EERE) under Solar Energy Technologies Office (SETO) Agreement Number 34172. SAND2020-1521 R
Authors:
- May Cai, Data Scientist, Trimark Associates
- Thushara Gunda, Senior Member of Technical Staff, Sandia National Laboratories
- Matt Kesselring, Data Scientist, Trimark Associates
Trimark Associates, Inc. designs, installs, maintains, and monitors utility-scale SCADA systems. Sandia National Laboratories is a multimission laboratory managed and operated by National Technology & Engineering Solutions of Sandia, LLC, a wholly owned subsidiary of Honeywell International Inc., for the U.S. Department of Energy’s National Nuclear Security Administration under contract DE-NA0003525.
— Solar Builder magazine
Leave a Reply
You must be logged in to post a comment.