The Smart Electric Power Alliance (SEPA)’s new report, the 2019 Utility Solar Market Snapshot, the educational non-profit found the U.S. solar market is still growing and notably expanding to new emerging state markets – there were 7.3 GWs interconnected in 2018, marking an 20.1% increase in total capacity over 2017.
Now in its 12th year, the Utility Solar Market Snapshot is based on interconnection data and market insights obtained directly from more than 500 utilities across the country, representing 74% of all customer accounts and 71% of all MWhs sold in 2018.
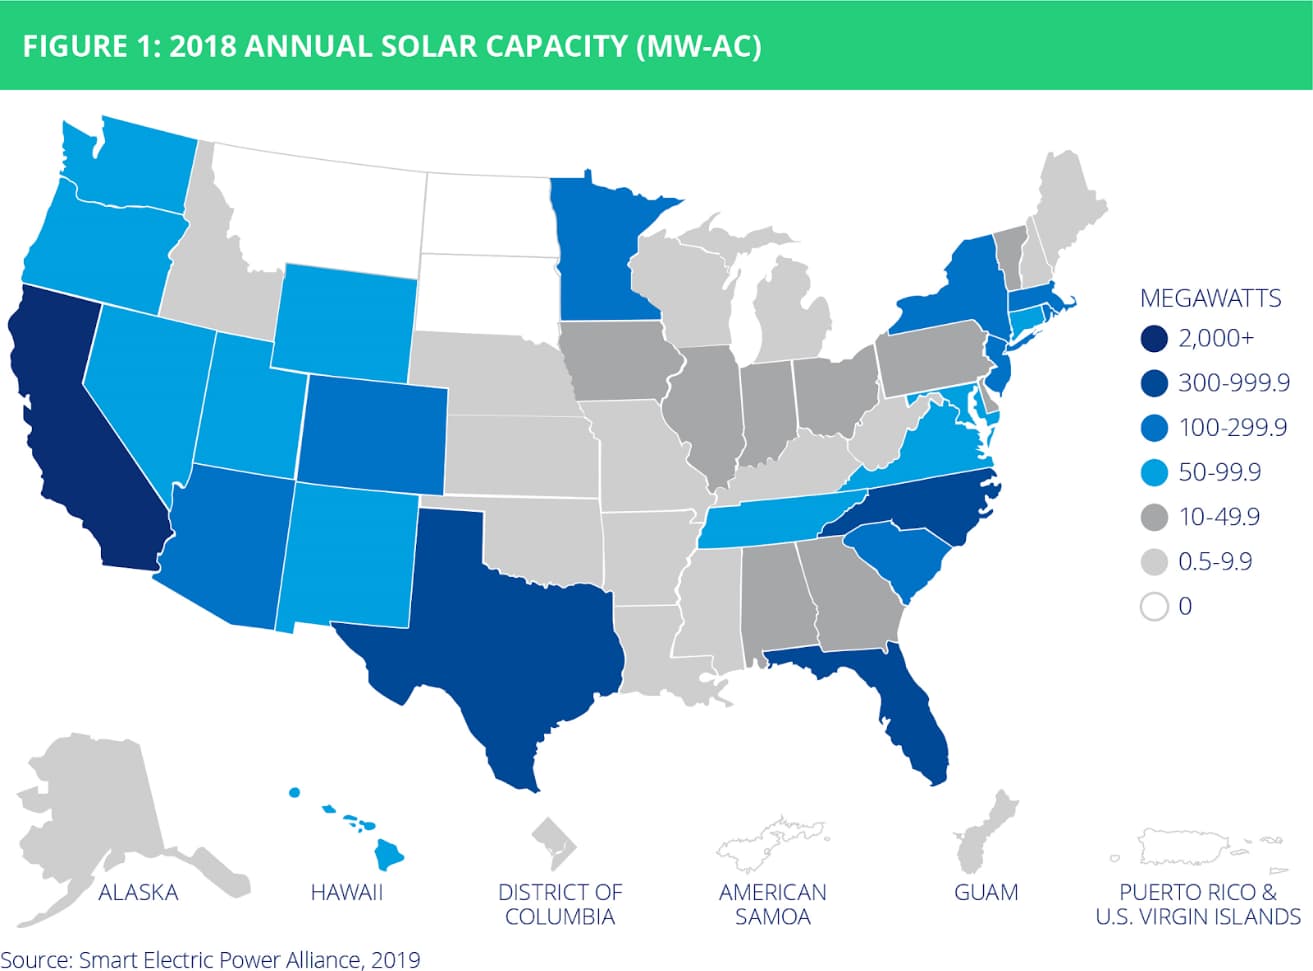
This year’s snapshot shows that the national market remains strong and competitive—despite minor cost impacts from the solar panel and steel tariffs of 2018. In fact, the market saw a geographical expansion beyond the traditional powerhouse markets (e.g., California and North Carolina), with Florida, Washington, and Rhode Island seeing year-over-year growth rates of 311.9%, 150.2% and 344.1%, respectively.
Key takeaways

• Utility-supply solar market experienced 15.1% growth nationally, driven by emerging state markets in Florida, Texas, Minnesota, South Carolina and Oregon.
• 20 states and DC have community solar policies in place and utilities have indicated a strong preference for utility-managed programs over third party-managed programs.
• State level solar policies related to solar compensation are evolving – most notably PURPA implementation rules and net metering successor tariffs.
• 2018 was the largest year for corporate renewable procurements, with 75 companies procuring a total of 6.5 GW, compared to 50 companies and 4.5 GW added in 2016 and 2017 combined.
Top 10 Utilities
Each year, SEPA recognizes the Top 10 U.S. utilities that interconnected the most new solar capacity in their service territories in two separate lists.
On the Top 10 Utility Solar Rankings by Annual Megawatts list, Pacific Gas and Electric (PG&E) maintained the No. 1 spot this year with 630 MW interconnected, while Florida Power & Light was second with 626.8 MW and Southern California Edison ranked third with 440.7 MW.
Reedy Creek Improvement District, the municipal district serving and powering Walt Disney World in Florida, took the top spot on the Top 10 Utility Solar Rankings by Annual Watts-Per-Customer list, with 1,819.6 W/C. Texas based Georgetown Utility Systems and Ohio based Village Electric Utility – Brewster ranked 2nd and 3rd respectively.
— Solar Builder magazine
Leave a Reply
You must be logged in to post a comment.