
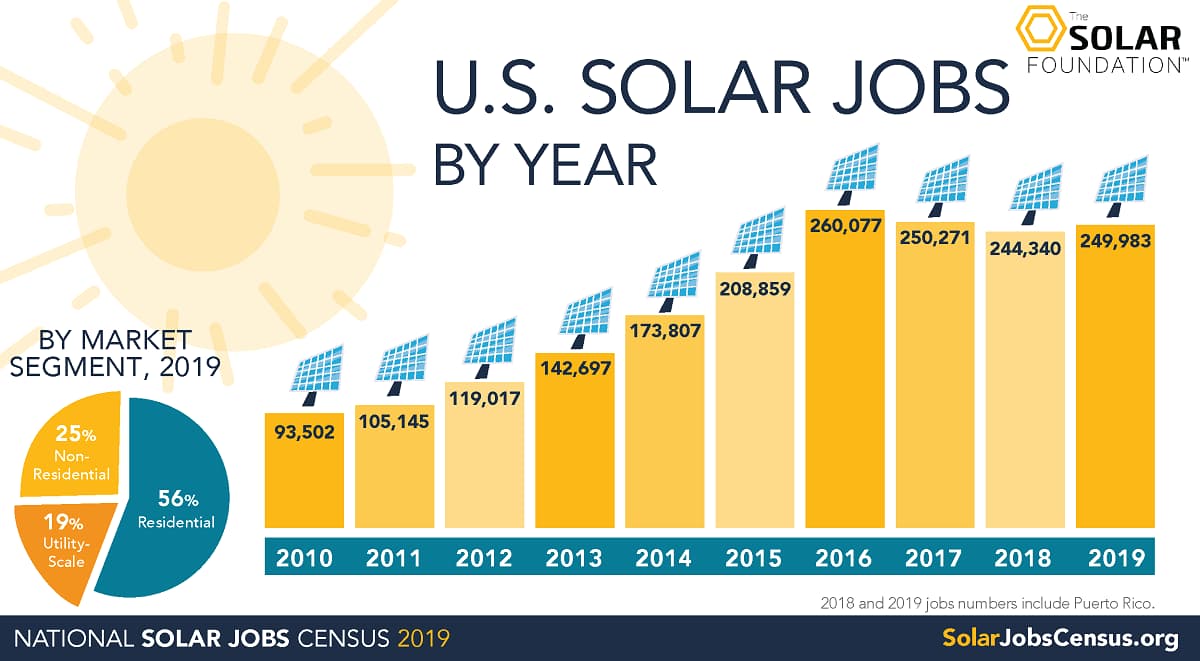
The U.S. solar industry employed nearly 250,000 workers in 2019, an increase of more than 5,600 jobs (or 2.3%) since 2018, according to the 10th annual National Solar Jobs Census released today by The Solar Foundation. This marks a resurgence in solar industry employment following two years of job losses in 2017 and 2018.
In the five-year period between 2014 and 2019, solar employment increased 44%, five times faster than job growth in the overall U.S. economy. Since the first Solar Jobs Census was published, American solar jobs have increased 167%, from just over 93,000 jobs in 2010 to 249,983 jobs in 2019.
“The solar industry has been one of America’s leading job creators over the past decade, as evidenced by our annual National Solar Jobs Census,” said Andrea Luecke, President and Executive Director of The Solar Foundation. “In just ten years, despite facing many challenges, solar has grown from a niche product to a mainstream energy source that provides a quarter of a million high-quality jobs. This is great news, but it’s only a fraction of what can be accomplished if we are truly committed to solving the climate crisis and expanding the use of solar and storage. It’s past time for us to unite as a nation and create even more jobs by harnessing the power of the sun.”
The Solar Foundation, a nonprofit educational and research organization, issues the National Solar Jobs Census each year to provide comprehensive and reliable data on the U.S. solar workforce. The National Solar Jobs Census is based on a rigorous survey of solar establishments conducted between October and November 2019.
Jobs by state
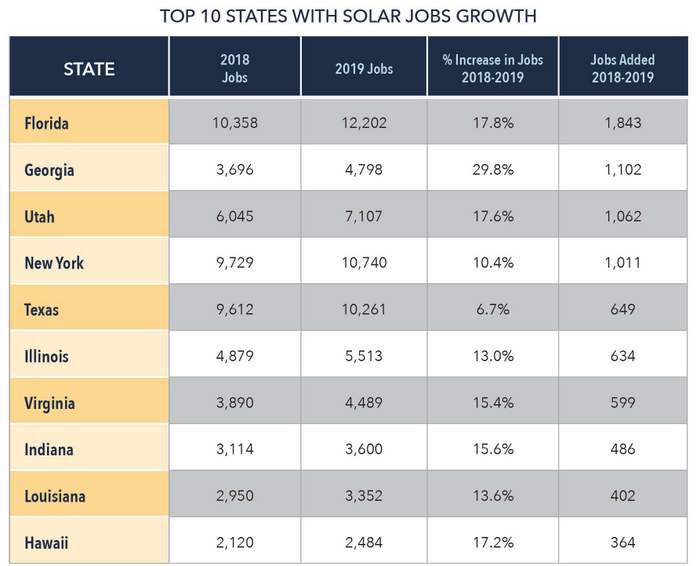
Solar jobs also increased in 31 states in 2019, and growth well outpaced the national average in many emerging solar markets. The state with the most jobs added in 2019 was Florida, followed by Georgia, Utah, New York, Texas, Illinois, and Virginia. The full report and a map of solar jobs in all 50 states, the District of Columbia, and Puerto Rico can be found at SolarJobsCensus.org.
Nationwide, the 249,983 solar workers include those who spend the majority of their time on solar-related activities. An additional 94,549 workers spent some portion of their time on solar-related work, for a total of 344,532 workers who spent all or part of their time in solar.
Most of the solar job gains in 2019 were in installation and project development, which added about 7,000 jobs in 2019. Overall, this industry sector employs 162,126 solar workers (nearly two-thirds of the 249,983 total), and about 16,000 of these workers focus on battery storage. The solar manufacturing sector grew by just under 700 jobs to a total of 34,423.

The Southeast and Mid-Atlantic regions were one of the bright spots in this year’s Solar Jobs Census. Florida has the second-highest number of solar jobs nationwide, growing 18% in 2019 for a total of 12,202 solar workers. Georgia solar jobs increased by 30%, the highest rate of growth in all 50 states, for a total of 4,798 jobs. South Carolina’s solar workforce was up 11% to 3,307 total jobs, and Maryland was up 8% to 4,854 jobs.
“South Carolina’s economy is booming and the growth of our renewable energy industry is a significant part of our success,” said Governor Henry McMaster. “As our state grows, we must continue to look for new ways to generate clean, affordable energy and make it accessible to our citizens.”
Nevada was the top state for the number of solar jobs per capita, with 7,000 solar workers, a 5% increase from 2018. Other Western states with strong job growth include Utah (18% growth, 7,107 total jobs); Colorado (5% growth, 7,174 total jobs); and Arizona (3% growth, 7,777 total jobs). In the Northeast, Massachusetts solar jobs were up 1.9% after two years of decline, with a total of 10,400 workers. Jobs were also up 16% in New Hampshire, with 1,031 total workers.
California still has by far the most solar jobs nationwide, but jobs declined by 3.4% statewide for a total of 74,255 workers. Other states with a notable decrease in solar jobs from 2018 to 2019 include Michigan, Minnesota, Missouri, New Jersey, New Mexico, Tennessee, Washington, and Wisconsin. Local jobs data by county, metro area, and legislative district is forthcoming in March 2020.
Survey collection efforts included approximately 66,900 phone calls and over 47,000 emails. The survey was administered to 2,766 establishments, of which 1,859 completed or substantially completed the survey. This provides a margin of error of 2.27% for the national jobs data.
— Solar Builder magazine

Leave a Reply
You must be logged in to post a comment.