Real-world examples help explain the tool used to evaluate companies in the solar industry.
By Matt Denninger
Bankability has always been important when evaluating vendors for the overall financial viability of a solar energy project, but the importance has increased considerably over the past several quarters among inverter companies, as module companies continue to operate under tremendous financial pressure and as some inverter companies have either left the North American market or entered liquidation.
Despite its importance, there does not seem to be a process or open-sourced method for monitoring bankability. Bankability involves “scoring” six critical quantitative and qualitative factors of a company: debt-to-equity ratio, balance sheet strength, profitability, history, transparency and diversification. The goal is that solar project stakeholders can understand how different inverter companies compare relative to one another in terms of bankability, at a level just a little more complex than reviewing a company’s available cash.
The factors are based on using a combination of financial and non-financial data that are publicly available. A low score for one factor in and of itself should not be seen as a significant issue, since the combined score of these factors are what provide a bankability score for a given company.
All this being said, it should be made clear that a low bankability score for a company does not imply that a project with its equipment is not viable. If the financing company also recognizes there is higher risk associated with the equipment company’s low bankability, then it is safe to imply that the cost of debt will be higher. Equity investors would likely require a higher return or other more strenuous conditions as an offset against the higher risk. By no means is a low score an indication of the company’s viability, but rather, a transparent method of making an apples-to-apples comparison. The Altman-Z score is seen by many to be a standard method to judge the risk of bankruptcy, and it is not discussed in this article.
The first three factors (debt-to-equity ratio, balance sheet strength and profitability) are based on financial data and carry a numerical score. The second three factors (history, transparency and diversification) are based on non-financial data, don’t change dramatically over time and are used for comparative purposes against other companies.
Debt-to-Equity Ratio
Homeowners do not typically discuss the ratio of their remaining mortgage principle to the equity that they have built in their home, but it’s an important tool for credit analysts when assessing companies. A company that has a high ratio typically has less flexibility to respond to market changes in the short term and not enough equity in the long term to fund long-term objectives. This score follows the standard risk classes used by credit analysts with the highest score for an A, the lowest score for a D and no score for negative equity.
Balance Sheet Strength
Most solar professionals have heard someone say, “Our balance sheet is very strong, just look at how much cash we have.” The problem is not everyone discusses the liabilities they have due over the next 12 months. There are a number of ways to measure balance sheet strength, but one of the more common is the short ratio, which compares cash to current liabilities. A company with a ratio of 1.5 means they have $1.50 in cash for every $1.00 in current liabilities and would achieve the best possible evaluation. A company with a ratio less than 0.25 would be on the lowest end.
Profitability
Taken alone, either of the two factors mentioned above may not be a problem over the short term. Companies take on debt to fund research and development activities, expand capacity or acquire another company. However, combining either of the two above with a low profitability score would be a cause for concern. This scoring method is best used when updated on a quarterly basis in line with public companies’ earnings releases which lends itself to the way profitability is scored. A company that was profitable in each of the most recent four quarters receives the highest score, and a company that was not profitable in each of the four most recent quarters receives a zero.
History
Companies that have been in business longer achieve a higher score because they have the institutional experience required to manage a supply chain and service organization to support the product for the life of the project. It is not enough for a company to have individuals with such experience. The organization needs to have tested and proven processes in place, which is more likely with companies that have been in business longer.
Transparency
Companies that provide greater financial disclosure by being listed on the U.S. or European stock exchanges receive the highest score for transparency. Other companies receive the lowest score for transparency as well as the three factors described above. It isn’t that non-listed companies have financial troubles. Rather, the higher score is reserved for companies that provide audited results in the public domain in accordance with third party rules and regulations.
Diversification
Diversification has a non-linear scoring method. Companies that are pure-play solar companies receive the lowest score because their fortunes change with the fluctuations in the market. We have seen how dramatic decreases in demand in certain parts of Europe have impacted certain companies. Companies that are well-balanced between solar and non-solar businesses receive the highest scores because the business cycles are expected to be offsetting. Conglomerates with very diverse business portfolios receive the second highest score. The reason being that the solar business would not garner enough attention or maintain flexibility because it would be only a small slice of the larger operations.
 Real-World Example: Satcon
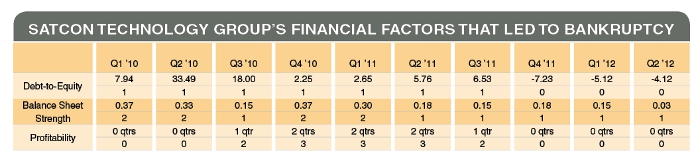
The bankruptcy of Satcon Technology Group, previously an inverter manufacturer before folding in February 2013, provides an interesting opportunity for a time series analysis using this scoring method. The table below includes the three financial factors and each factor has two rows: the top row is the actual result and the bottom row is the unweighted score on a scale of 1 to 5 with 5 being the most bankable. For example, the debt-to-equity ratio was 7.94 in Q1 2010 and generated an unweighted score of 1. Scoring zero is a rare occurrence, happening with a negative debt-to-equity ratio and four, consecutive unprofitable quarters.
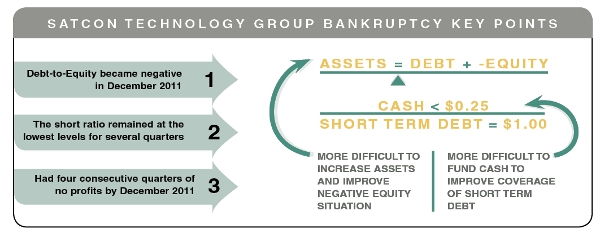
What happened in Q4 2011 can be considered a perfect storm. Satcon’s debt-to-equity ratio became negative after seven consecutive quarters of relatively high ratios. Balance sheet strength, as measured by the short ratio, had generated a third consecutive quarter below 0.25. A ratio of 0.18 implies Satcon had $0.18 in cash for every $1.00 of liabilities owed over the next 12 months. And finally, Satcon returned to having four consecutive quarters of unprofitability (as denoted by the “0 qtrs”). The lack of profits over a sustained period made it very difficult to fund either their assets to improve their debt-to-equity ratio or their cash to improve their short-term debt coverage as shown in the diagram above. This was a very precarious situation for Satcon. While it didn’t predict the company’s bankruptcy, this tool could have created a critical discussion point for solar project developers assessing a low-cost inverter manufacturer’s bankability.
This method of scoring bankability is intended to be an open source, straightforward tool to objectively assess bankability. It considers many of the value propositions companies use when presenting their strengths in an objective, measurable manner. The weighting across the factors and scoring methodology can be adjusted to suit your business’ appetite for risk. With a more open and simple method for measuring bankability, the hope is to generate a more open conversation about what is important to suit various business models and help the solar industry grow in a sustainable manner.

[source: http://www.solarbuildermag.com/featured/bankability-solar/]
Leave a Reply
You must be logged in to post a comment.