
This is an article from the Q2 issue of Solar Builder magazine, co-authored by Aaron Hall, president of Anza Renewables and Scott Meredith, product owner of the Anza Engine — a model designed to emulate PVsyst’s accuracy with significantly improved runtime over PVsyst. Subscribe to Solar Builder magazine for free (print or digital) right here.
Production models are important indicators for solar project performance and, ultimately, revenue. Financiers hire independent engineers (IE) to evaluate production models from developers and independent power producers (IPPs) to make critical funding decisions. Developers and IPPs planning to own long-term projects also evaluate production models to assess module choices beyond initial cost to determine which will ultimately deliver the most value over a project’s life cycle.
Production models rely on PAN files to capture the attributes of a module that will impact its performance. Having accurate module data in these files is key for generating quality performance estimates. Unfortunately, PAN files are too often taken at face value, without sufficient evaluation of the supporting data or an analysis of how well the PAN file fits the information. It’s essential that solar project stakeholders realize the disparities in PAN files, understand how variable data can directly impact performance models, and take steps to evaluate PAN file bankability as thoroughly as possible.
What’s in a PAN file?
PAN files are small text files with the extension “.PAN” that contain the data required to characterize the performance of a module. While they’re most commonly used to run simulations in the popular software PVsyst, they can also be used in other production modeling applications.
PAN files are typically provided by the supplier, but can be based on either manufacturer or third-party testing lab data. A PAN file is composed of a few unique parts, all of which contribute to the performance of the module when used in a simulation:
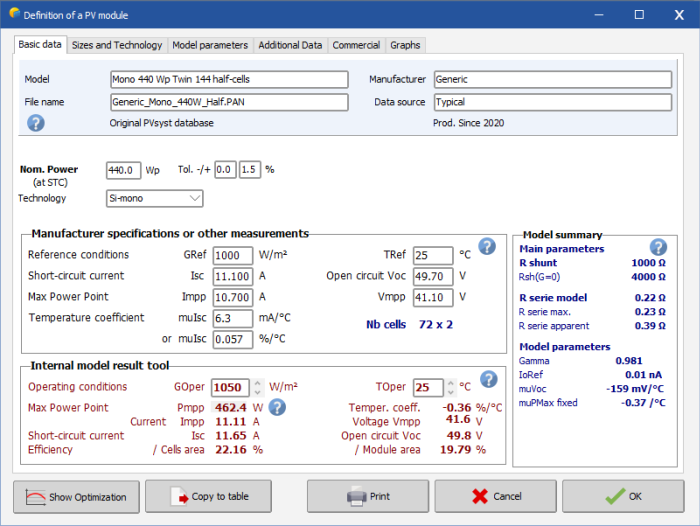
Base PAN file: The “base” PAN file includes the input parameters to the single diode model that determines the module performance under different temperature and irradiance conditions. The manufacturer or a third-party lab can generate these parameters.
Light-induced degradation (LID): LID represents performance loss from sunlight within the first few weeks of module exposure. LID is typically tested at a third-party lab using a specific number of module samples and exposure requirements. Testing usually yields an LID value of a few tenths of a percentage point. Anza recommends assuming an LID value of 0.6% without quality testing data.
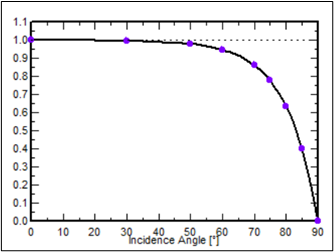
Incident angle modifier (IAM): IAM measures how much light is reflected off a module’s surface rather than absorbed by the module cell. IAM is typically defined as a profile in which the values vary between 0 and 1 as a function of the incidence angle. IAM testing is conducted by measuring short-circuit current and calculating an IAM value for each angle tested. In the absence of IAM test data, we recommend using an ASHRAE profile with b0 = 0.04 for modules with anti-reflective coating and b0 = 0.05 for modules without.
Bifaciality factor: This is the ratio of a module’s rear-to-front power under standard test conditions (STC). The higher the bifaciality factor, the greater the project’s bifacial gain. Without test data, this value is taken from the manufacturer’s datasheet. PERC modules typically have a bifaciality factor of 0.7, whereas TOPCon modules are at 0.8.
Power tolerance: This is the allowed delta between the rated or nameplate power of the module at STC and the tested power of the module at STC. Power tolerance is used to determine the module quality loss (MQL) in PVsyst, which is typically calculated as the lower quarter point of the tolerance value. The power tolerance expressed in the PAN file usually results in a performance gain to the model because most manufacturers down-bin their modules.
A manufacturer first creates a PAN file early in a module’s lifetime with limited test data. Although the PAN file may undergo several revisions as more module performance data is collected, the manufacturer will not likely release any internal test data. Because performance can’t be validated against reliable test data, using a manufacturer PAN file in a simulation adds a level of uncertainty to the results.
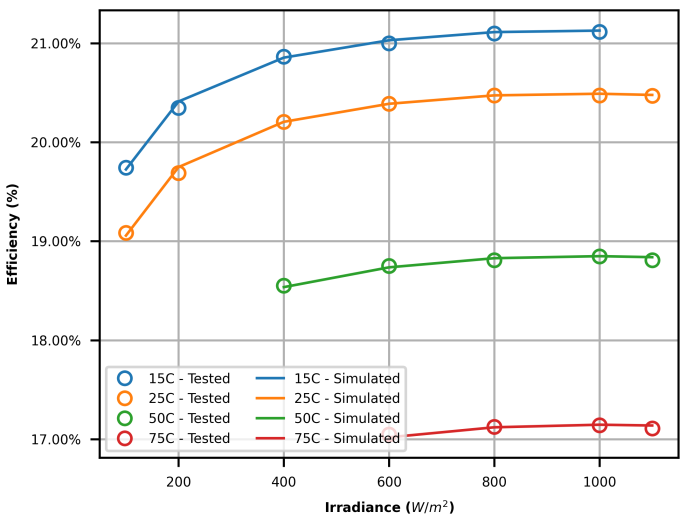
Conversely, third-party PAN files are generated from testing labs based on reported data. Typically, these labs perform flash testing on samples using 22 different irradiance and temperature combinations, as prescribed by IEC standard 61853-1. After completing testing, the labs modify a set of four to five parameters in the PAN file to fit the simulation results to the test data.
Evaluating PAN files
Performing due diligence on all module test data and generating a PAN file representing the most updated information is necessary to provide an accurate yield prediction for each module choice.
For tips for evaluating PAN files provided by a manufacturer or third-party, and an example of how much poor data can cost you, access the full article in the digital edition of Solar Builder, starting on page 50.
Solar Builder Instant Access Q2 2023
Get instant access to the digital edition of Solar Builder magazine.
— Solar Builder magazine

[source: https://solarbuildermag.com/featured/how-to-evaluate-solar-pv-module-pan-files/]
Leave a Reply
You must be logged in to post a comment.