The U.S. solar market felt the negative impact of the #TrumpTariffs as installed capacity decreased year over year (- 9 percent) and quarter over quarter (- 7 percent) in Q2 2018 despite decreases in component pricing. But fear not, because the data is pointing to a market turnaround.
According to the latest U.S. Solar Market Insight Report from Wood Mackenzie Power & Renewables (previously known as GTM Research) and the Solar Energy Industries Association (SEIA), utility solar project procurement soared in Q2 2018 as component prices declined and home solar installations steadied after a 15 percent contraction last year. Looking ahead, the report forecasts an acceleration of solar deployment in the second half of 2018 driven by utility-scale projects.

The report projects a flat 2018 for the solar market as a whole. Most of the utility solar being procured today will come online in the 2020 timeframe. By then, 28 states in the U.S. are expected to be adding at least 100 MW of solar annually, and 25 states will have more than 1 GW of solar PV — compared with only two states at that capacity in 2010.
“The data shows us that the tariffs have dampened solar’s growth, as previously announced projects were canceled or delayed due to the tariffs,” said Abigail Ross Hopper, SEIA’s president and CEO. “Yet, this report also reveals that the solar industry is simply too strong to be kept down. Procurement numbers show that solar is poised for substantial growth.”
Total installed U.S. PV capacity is expected to more than double over the next five years. By 2023, over 14 GWdc of PV capacity will be installed annually.
Utility boom
According to the report, 8.5 GW of utility PV projects were procured in the first six months of the year, the most ever procured in that timeframe. This includes 26 projects exceeding 100 MW. Some of these were on hold in 2017 due to uncertainty around the tariffs.
FIGURE: U.S. Utility PV Pipeline

Source: Wood Mackenzie Power & Renewables
“Once lower-than-expected module tariffs were announced in January 2018, developers and utilities began announcing new projects,” Wood Mackenzie Senior Analyst Colin Smith writes in the report. “As we move toward 2019, we expect to see continued procurement growth as developers look to secure projects they can bring online before the Investment Tax Credit (ITC) steps down to 10 percent in 2022.”
As a result of the surge in procurement, Wood Mackenzie Power & Renewables has increased its 5-year forecast for utility-scale solar by 1.9 GW. That is still 8 percent lower than was projected before the tariffs were announced.
Residential
Module prices are at their second lowest mark in history even with the addition of a 30 percent tariff. “Except for residential PV, U.S. system prices are at their lowest levels ever,” the report said.
In the residential market, 577 MW were installed in the second quarter of the year, essentially flat on both a quarterly and an annual basis. Declines in previous quarters were less a symptom of the tariffs but instead a result of customer acquisition challenges and the scaling back of several large installers. The report points to the leveling out of the market as a sign that customer acquisition challenges may be subsiding. Emerging residential state markets like Florida and Nevada posted large gains in installations and helped the segment rebound.
Community solar
Community solar continues to see rapid growth. Led by Massachusetts and Minnesota, more than 300 MW of community solar were installed in the first half of the year. The build out is expected to continue in the second half of the year.
FIGURE: U.S. PV Installation Forecast, 2010 – 2023E
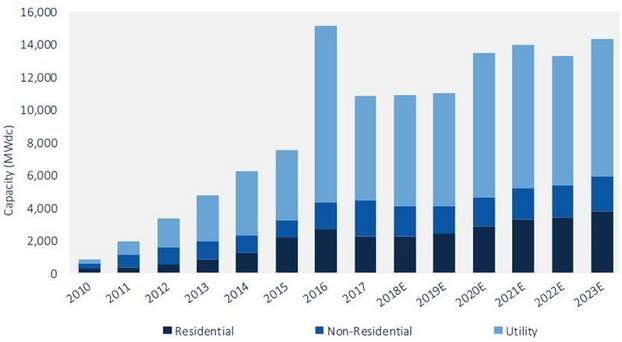
Source: Wood Mackenzie Power & Renewables
In the first half of 2018, 29% of all new electricity generating capacity brought online in the U.S. came from solar PV.
Non-residential PV fell 16% quarter-over-quarter and 8% year-over-year. But corporate procurement of utility PV through physical PPAs, virtual PPAs, and green tariffs has grown to account for 12% of projects in development.
— Solar Builder magazine

Leave a Reply
You must be logged in to post a comment.