
Solar PV module manufacturer financial health is hugely important because success in solar often comes back to product procurement — and the long-term viability of the company standing behind those products. In the Q2 edition of Solar Builder magazine, we have an exclusive look at quarterly financial rankings produced by Sinovoltaics, a quality assurance, ESG & traceability firm for the solar and battery energy storage system (BESS) industries.
The PV Module Manufacturer Rankings are just one of several quarterly financial reports from Sinovoltaics. Solar developers utilize each of Sinovoltaics’ PV component financial ranking reports (modules, inverters, energy storage) as an objective tool to evaluate a manufacturer’s financial stability and procurement decisions. Here are the Q1 2024 Inverter Rankings.
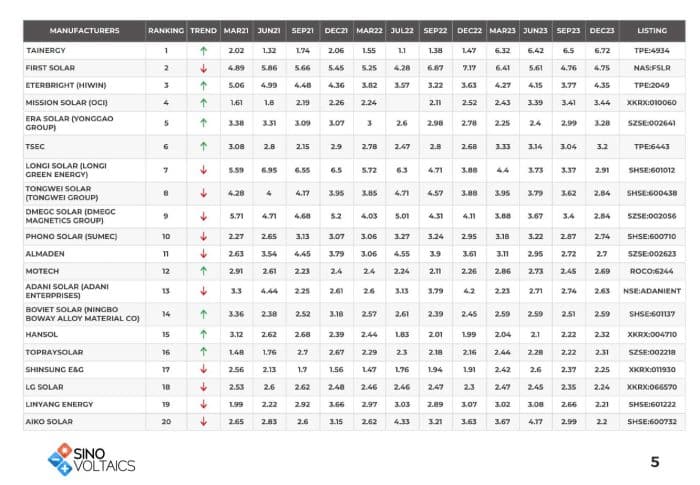
Since 2016, the Sinovoltaics team has gathered publicly available financial data and ranked each solar PV module, energy storage, and inverter company by applying the Altman Z-Score, a well-established financial evaluation tool widely used in the finance sector to assess the financial health of various manufacturing industries.
Here is the Sinovoltaics PV Module Manufacturer Ranking from the 1/2024 edition. Note: This score can only be calculated for public companies, so you will not see private companies in the rankings.


PV Module Manufacturer Ranking Methodology
The Altman Z-Score assesses a company’s financial strength through a credit-strength test based on profitability, leverage, liquidity, solvency, and activity ratios.
Altman Z-Score = 1.2A + 1.4B + 3.3C + 0.6D + 1.0E
- A. Working Capital / Total Assets: measures liquid assets in relation to the size of the company
- B. Retained earnings / Total Assets: measures profitability that reflects the company’s age and earning power.
- C. Earnings Before Interest & Tax/Total Assets: measures pp[erating efficiency apart from tax and leveraging factors. It recognizes operative earnings as being important to long-term viability.
- D. Market Value of Equity/Total Liabilities. Adds market dimension that can show up security price fluctuation as a possible red flag.
- E. Sales/Total Assets: a standard measure for total asset turnover.
The PV Module Manufacturer Ranking scores are categorized into 3 zones: Safe Zone (green), Grey zone, and Distress Zone (red). A score that is 1.1 or lower indicates a higher probability of bankruptcy within the next two years, while a score of 2.6 or greater indicates a solid financial position.
The Sinovoltaics PV Module Manufacturer Ranking report notes that, ideally a manufacturer is in the Safe Zone, but some manufacturers have been in the Grey Zone or lower for years and continue to be in business. However, based on the Altman Z-Score formula and studies about its accuracy, the bankruptcy risk is significant.
Solar Supply Chain Map
Sinovoltaics also sent over its first North America Solar Supply Chain Map, based on the latest fourth quarter of 2023 data. An updated version of the infographic map and factory capacity data will be released every four months at sinovoltaics.com. Click to expand.

The complimentary infographic and data pages reveal the existing and future PV manufacturing facilities in the United States, Canada, and Mexico. In addition to showing existing North American supply chain factories in 2023, the download also includes all known announced factories that are expected to start production by 2027.
The map provides a visual representation of the spread of solar manufacturing facilities across North America, as well as regions where manufacturing is concentrated as well as a corresponding directory that includes the locations and up-to-date information on which components are produced at each factory.
— Solar Builder magazine
Leave a Reply
You must be logged in to post a comment.