
The imposition of tariffs on imported solar cells and modules is more a matter of when than if at this point considering the Administration in charge, so GTM Research has been furiously crunching the numbers to understand the fallout across the U.S. solar market based on different tariff scenarios. Here’s a glimpse into that crystalline ball.
Reminder: The ITC will vote on Oct. 31 on a remedy recommendation, submit that recommendation to the White House on Nov. 13, and then Trump will have until January to make a decision. That decision will be imposed 14 days later.
A note from the GTM team: “Our team has been working on this analysis for over a month, so our scenarios (which range from $0.10/W-$0.40/W cell tariffs, in increments of $0.10/W) don’t perfectly match with either Suniva or SolarWorld’s proposed remedies. But SolarWorld’s request aligns closely with our $0.30/W cell tariff, and Suniva’s request is close to our $0.40/W cell tariff scenario.”
Current situation

Tariff risk has caused module prices to increase, a phenomenon unique to the U.S. While cost reductions in other parts of the system make up some of the difference, the cost to install solar has increased for the first time in ages.

So what comes next?

If tariffs are imposed, GTM estimates that there will be nearly five GW of solar capacity that is not subject to tariffs, either because it is not subject to the scope of the petition (i.e. thin film) or because both the cells and modules are manufactured in the U.S., Korea, Singapore, Canada or Australia, all of which may be exempt. In addition, over 2 GW of modules have already been procured for 2018 projects, which will temporarily dampen the tariffs’ impact on demand.
Those five gigawatts won’t be nearly enough to sustain the market, which is otherwise expected to reach nearly 11 GW in 2017, rising to over 16 GW by 2022.
Tariff impact demand
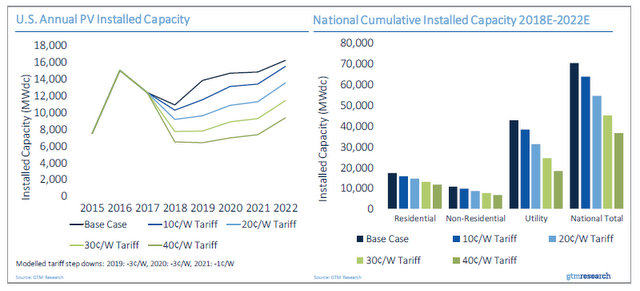
GTM estimates that the net impact to its base forecast could range from just 9 percent under a 10₵/W tariff to 48 percent under a 40₵/W tariff. The biggest impacts would be in the utility-scale solar sector, which is most sensitive to price in-creases, while the residential sector would be the most resilient.

Every segment, in every state, will be unique. In the residential sector, the biggest volume impacts would be felt in the largest state markets, but nascent states that have just begun to develop vibrant residential solar sectors could disappear almost entirely.
The utility-scale market would be most sensitive because two-thirds of the project pipeline is driven by solar’s razor-thin economic competitiveness with other generation sources.

But even the utility solar market could weather a 10₵/W cell tariff with relatively minimal disruption – just over 10% by our estimate.

— Solar Builder magazine

Leave a Reply
You must be logged in to post a comment.